ERA5-Atlas
The MODES reanalysis atlas presents low-resolution climatology of the atmospheric flow for 40 years (1980 to 2019) of ERA5 reanalysis data (Hersbach et al., 2020).
The unique feature of the atlas is the linear decomposition of the circulation using the MODES software. MODES projects the global fields of horizontal velocity and geopotential height on a number of vertical levels and projects them into linearly balanced and unbalanced eigenvectors of the linearised primitive equations. The two solutions are referred to as (linearly) balanced and unbalance modes or circulations. The balanced modes comprise the Rossby and the mixed Rossby-gravity waves while the unbalanced modes include the eastward-propagating and the westward-propagating inertia gravity (EIG and WIG, respectively) waves and the Kelvin waves. Much of our understanding of atmospheric dynamics comes from considering these two regimes although their discussion has traditionally been carried out by using different sets of simplified equations. Wave filtering involves no assumptions on wave propagation, i.e. it is performed at selected processing times. Coherent temporal features reveal the extent to which the wave dynamics are quasi-linear. In the linear decomposition, the ageostrophic motion associated with the Rossby wave dynamics according to quasi-geostrophic theory project onto the EIG and WIG modes. The realism of filtered inertia-gravity waves was made evident in a number of studies e.g. J. Atmos. Sci. 2017.
The linear theory behind MODES and its application for understanding to atmospheric energy distribution and transfers are described in the 2020 book Modal View of Atmospheric Variability, and references therein. The three-dimensional modal decomposition consists of the vertical and horizontal parts. The horizontal part is performed by Hough harmonics which are the eigenfunctions of the linearized primitive equations on the sphere. Their coupling to the vertical structure equation is through the equivalent depth which corresponds to the mean depth of the associated barotropic model. Horizontal structures of the Hough harmonics for different depths can be found here.
MODES setup for the ERA5 Atlas
The atlas is based on daily data at 12 UTC on a T85 Gaussian grid (approx. 1.4° x 1.4° at the equator) and 43 terrain-following sigma levels extending up to approximately 0.4 hPa. These levels were selected as a common set for the intercomparison of four modern reanalyses. The decomposition uses 100 zonal wavenumbers and 50 meridional modes for each of three wave species; that is, 49 Rossby modes and the mixed Rossby-gravity wave, 50 westward-propagating inertia-gravity modes, 49 eastward-propagating inertia-gravity modes and the Kelvin wave are considered. There are 27 vertical structure functions (or vertical modes) with equivalent depths ranging from about 10 km to about 8 meters. The balanced and unbalanced circulations shown in the atlas result from a back transformation of the respective modes to physical space, i.e. to velocities on the Gaussian grid at sigma levels. The “total” circulation is an inverse filtering of all modes and also a sum of the balanced and unbalanced components.
Latitude-Pressure
Total circulation
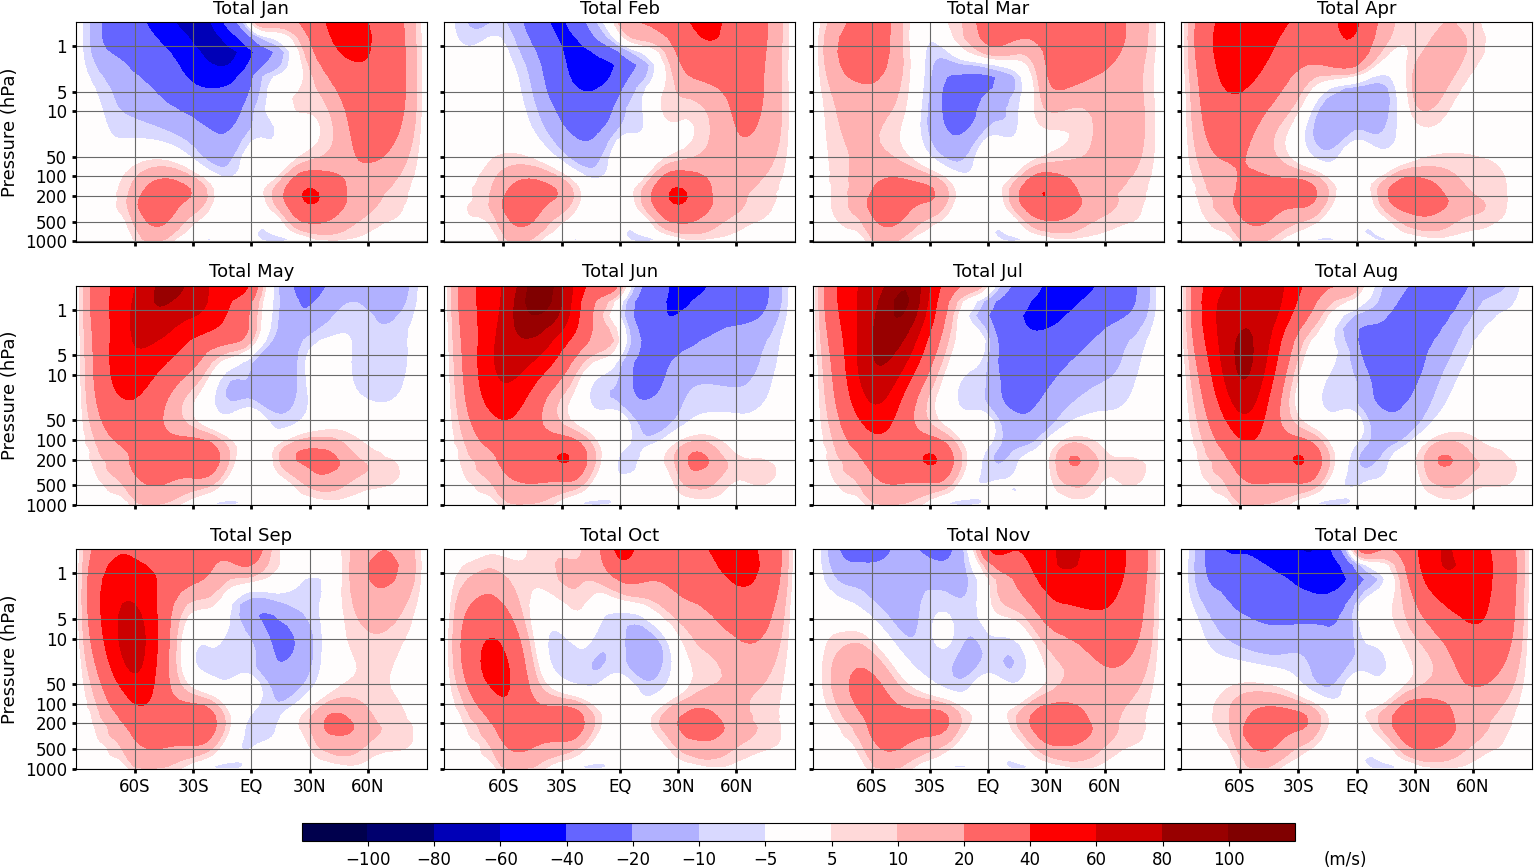
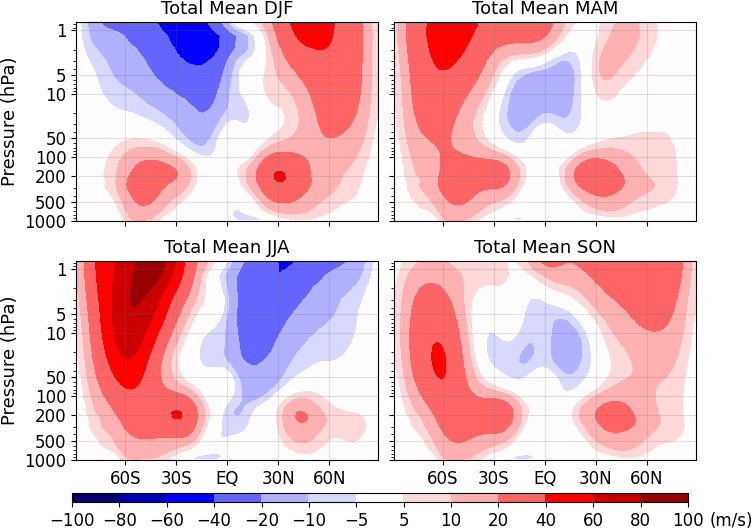
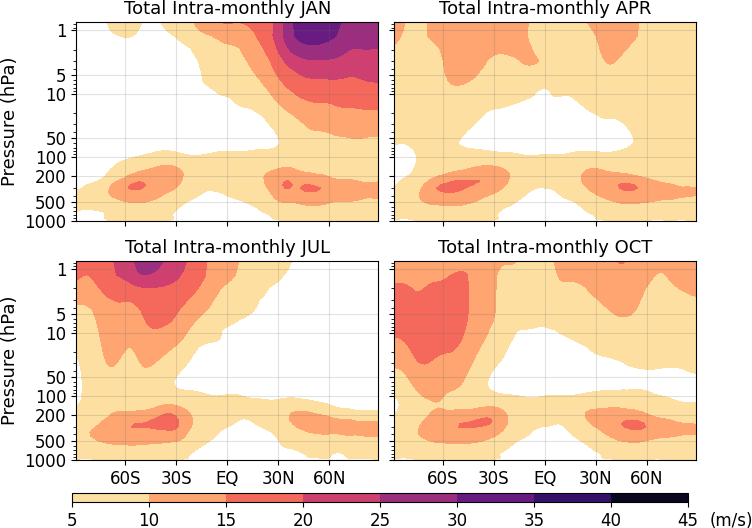
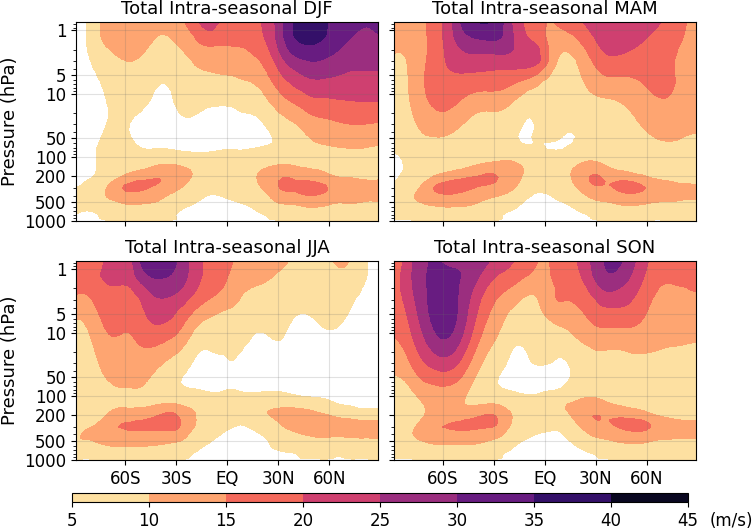
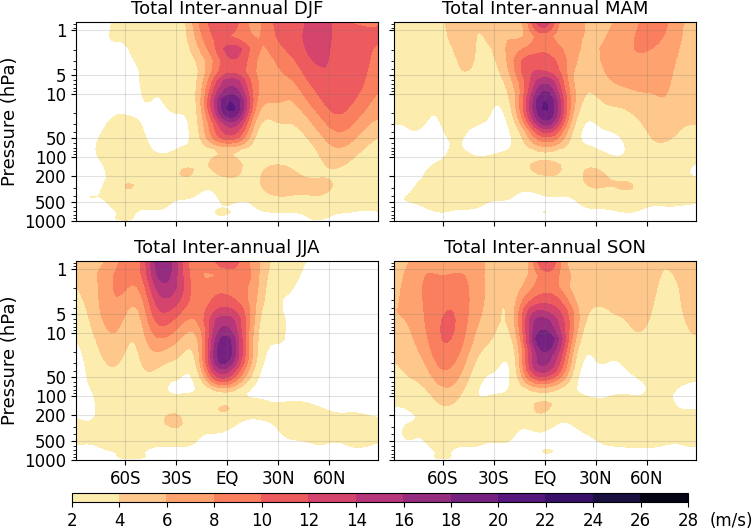
Latitude-pressure cross sections of the climatological (1980-2019) seasonal averages of the zonally averaged zonal wind, the intra-monthly variability (standard deviation) of the zonal wind, the intra-seasonal variability (standard deviation) of the zonal wind and the inter-annual variability (standard deviation) of the zonal wind. The winds were obtained by summation of all modes.
| Monthly mean | Seasonal mean | Intra-monthly variability | Intra-seasonal variability | Inter-annual variability |
 |
 |
 |
 |
 |
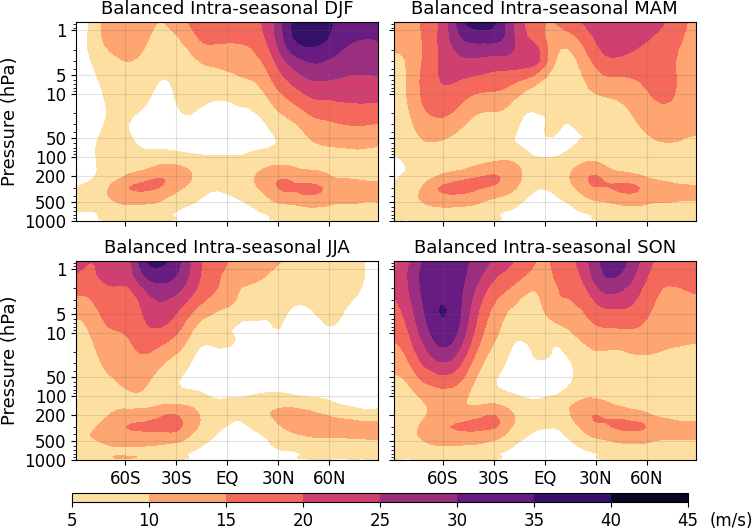
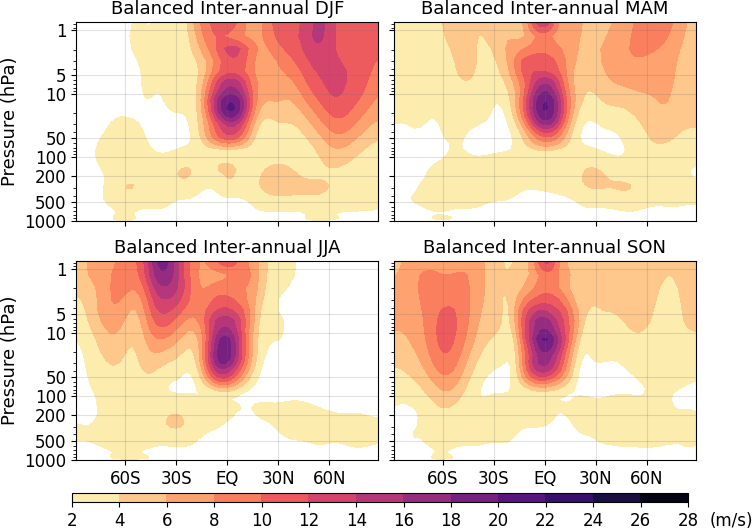
Balanced Circulation
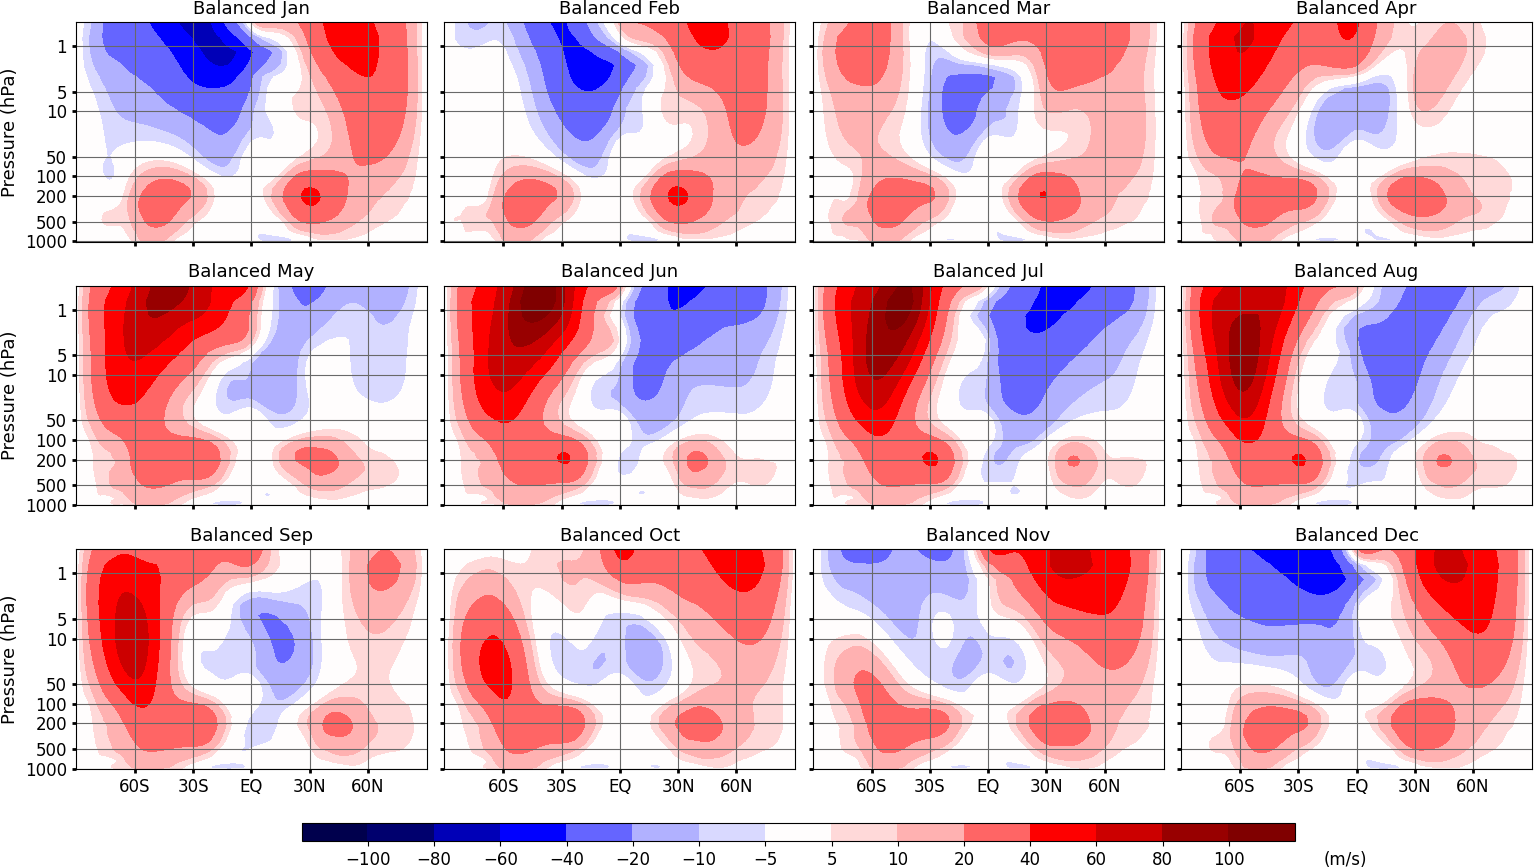
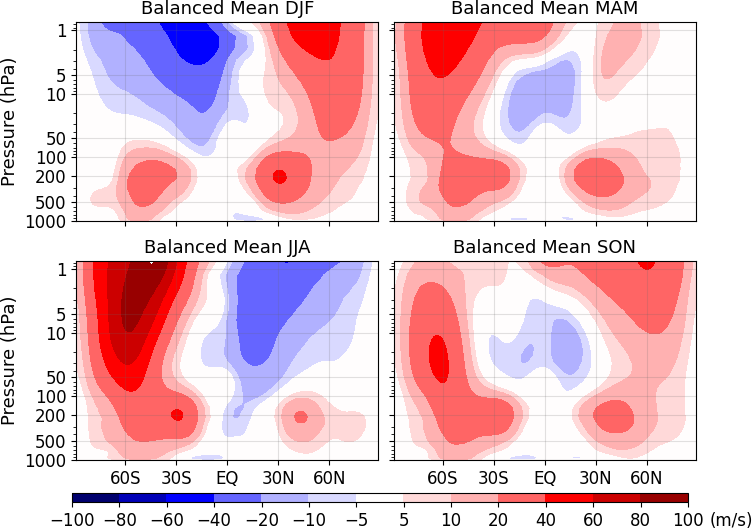
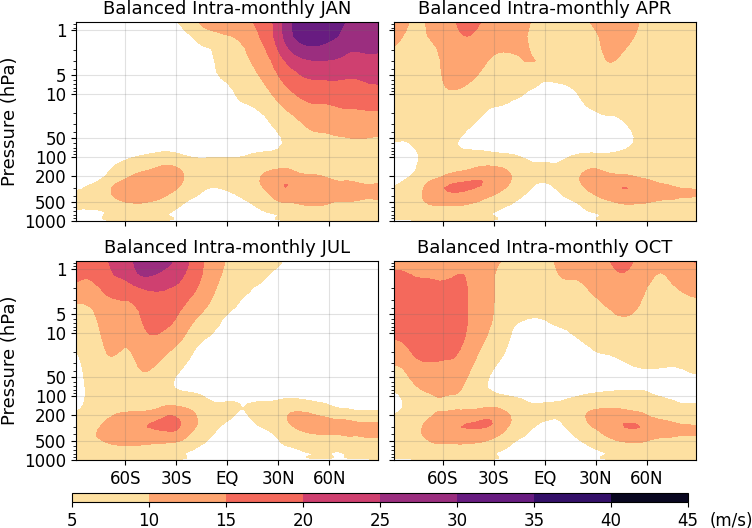
Latitude-pressure cross sections of the climatological (1980-2019) seasonal averages of the zonally averaged zonal wind, the intra-monthly variability (standard deviation) of the zonal wind, the intra-seasonal variability (standard deviation) of the zonal wind and the inter-annual variability (standard deviation) of the zonal wind. The winds were obtained by summation of all linearly balanced (Rossby and mixed Rossby-gravity) modes.
| Monthly mean | Seasonal mean | Intra-monthly variability | Intra-seasonal variability | Inter-annual variability |
 |
 |
 |
 |
 |
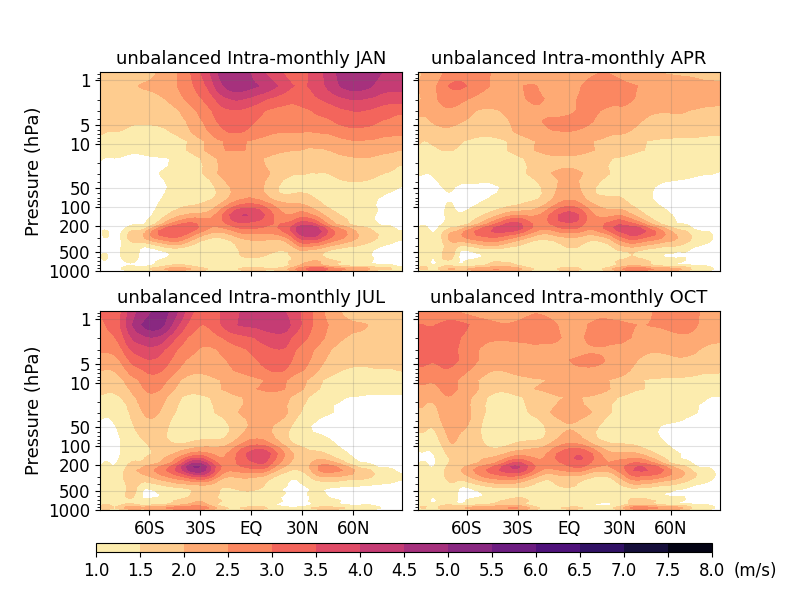
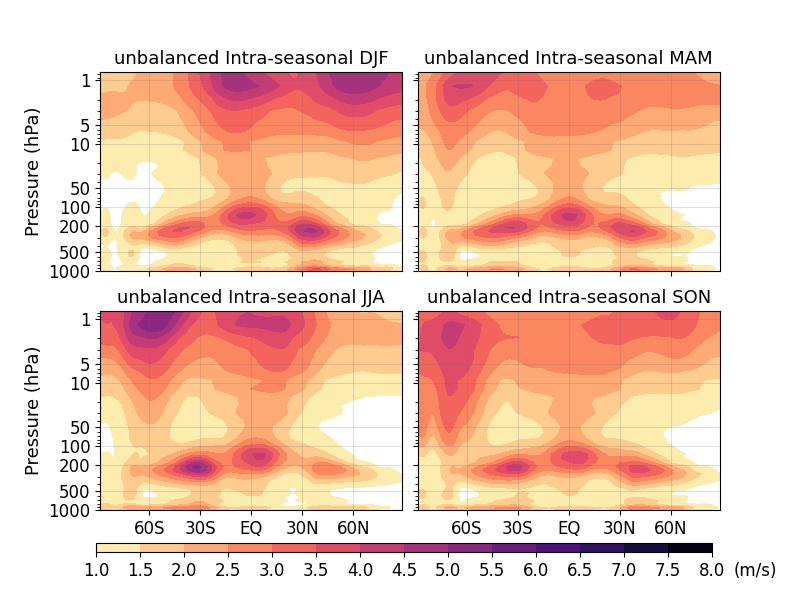
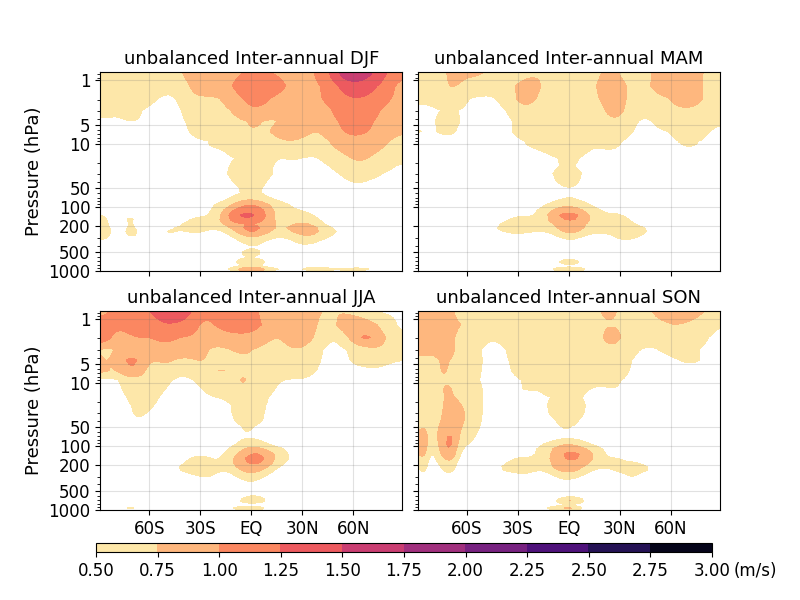
Unbalanced Circulation
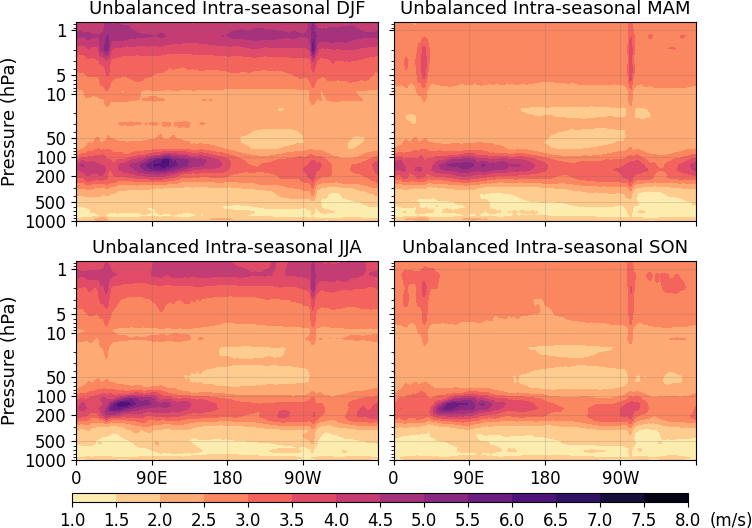
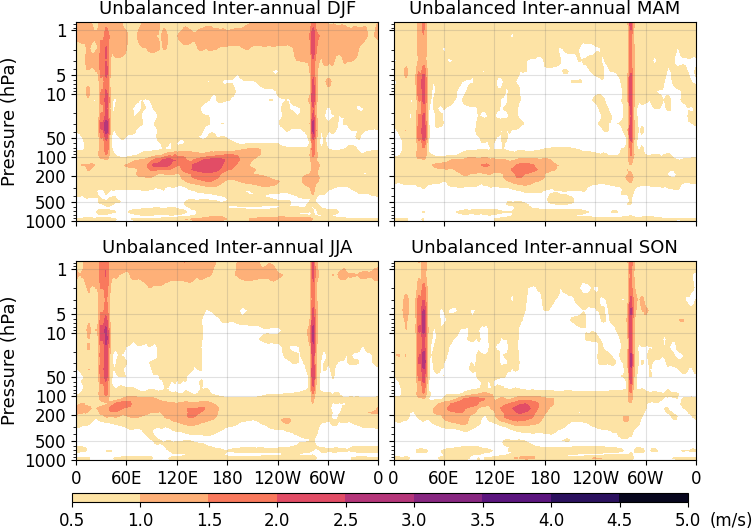
Latitude-pressure cross sections of the climatological (1980-2019) seasonal averages of the zonally averaged zonal wind, the intra-monthly variability (standard deviation) of the zonal wind, the intra-seasonal variability (standard deviation) of the zonal wind and the inter-annual variability (standard deviation) of the zonal wind. The winds were obtained by summation of all unbalanced (inertia-gravity and Kelvin) modes.
| Intra-monthly variability | Intra-seasonal variability | Inter-annual variability |
 |
 |
 |
Longitude-Latitude
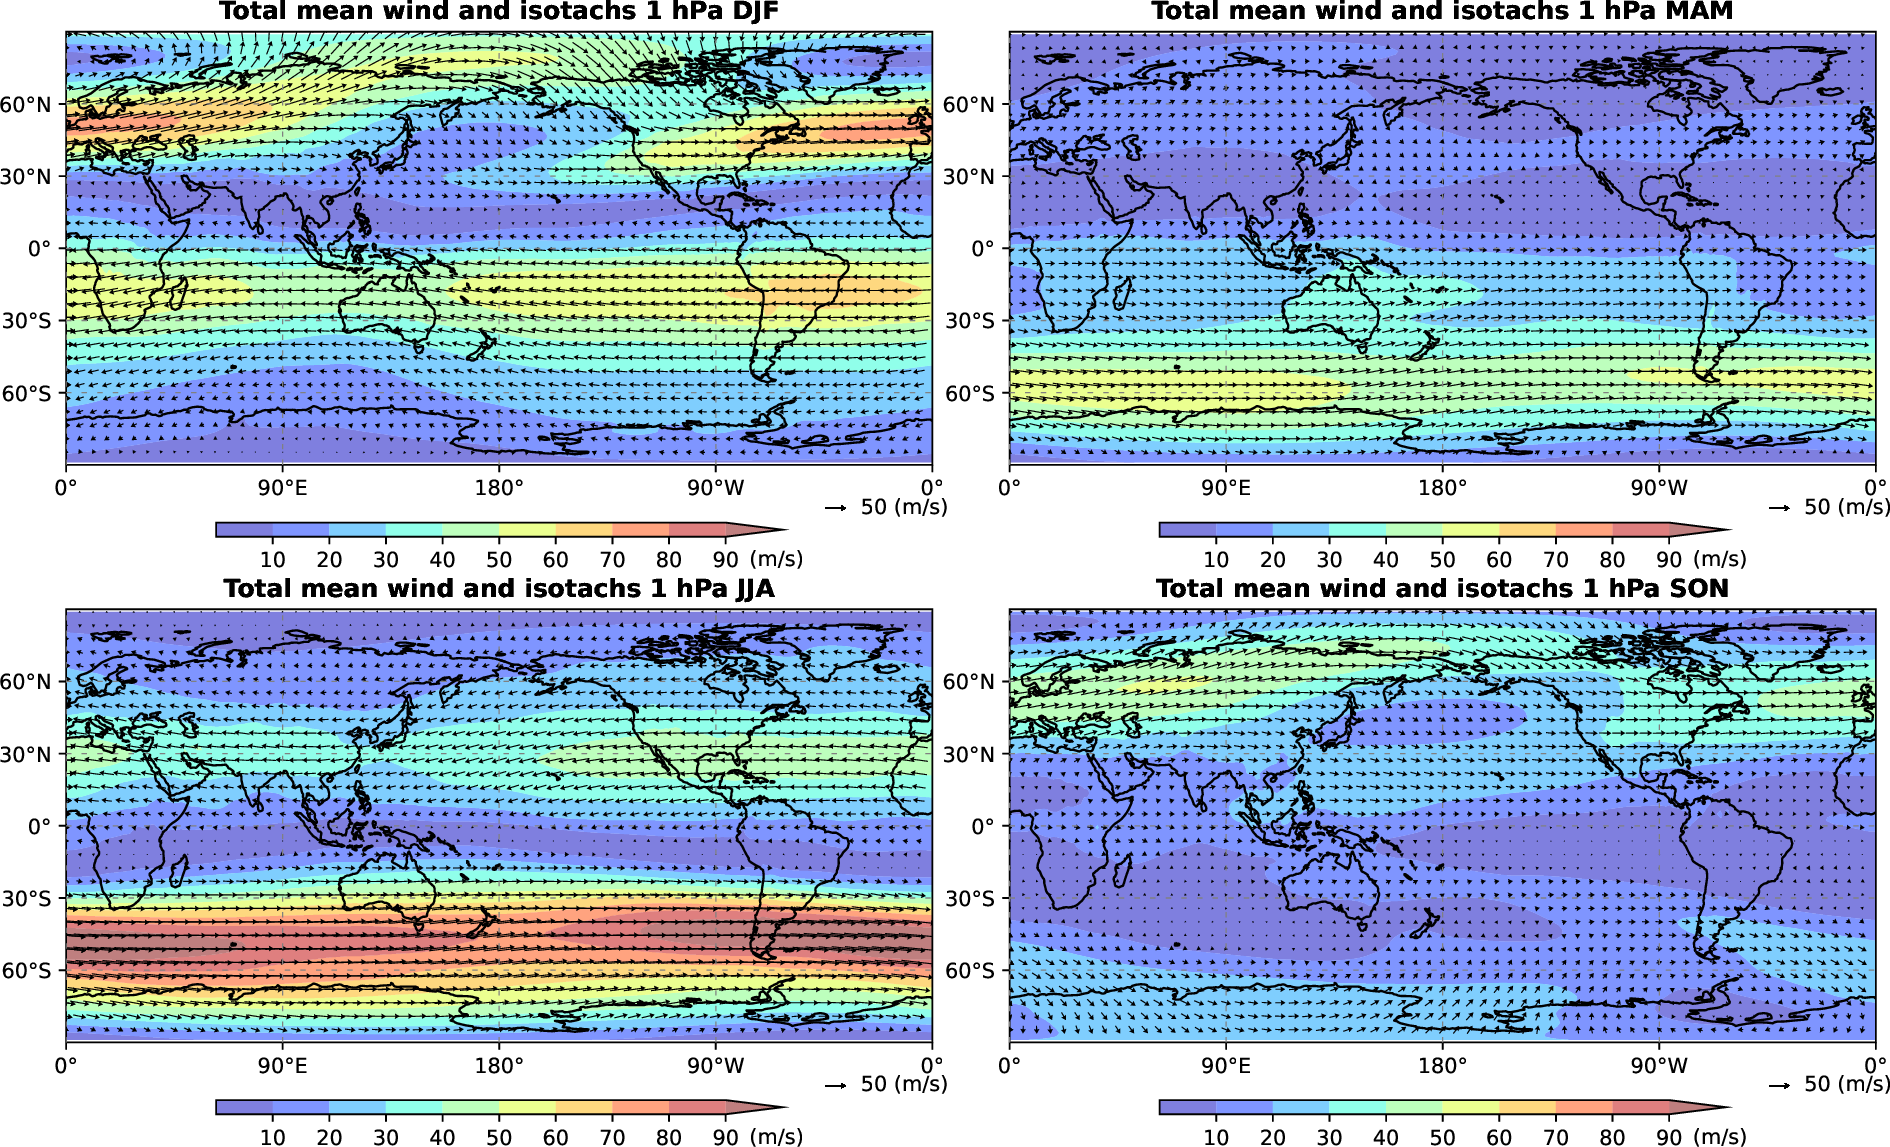
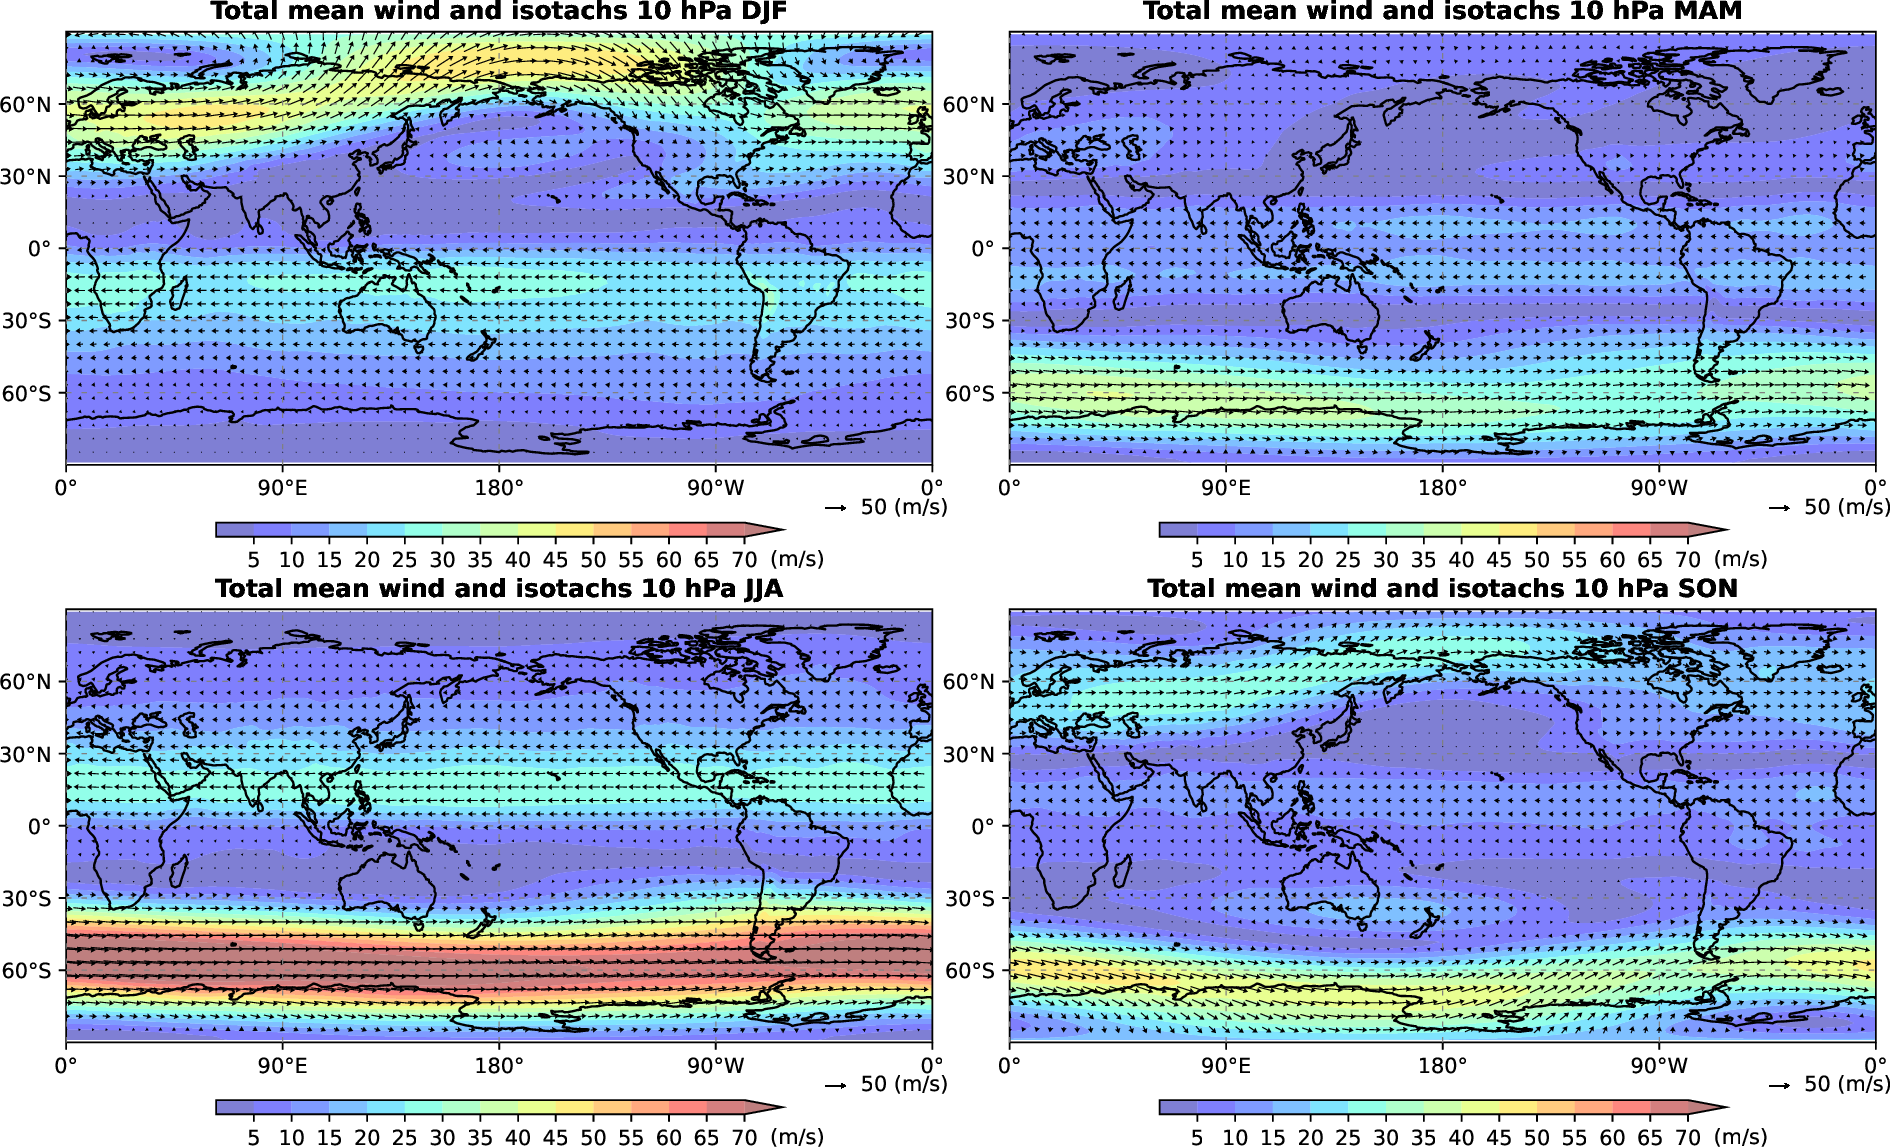
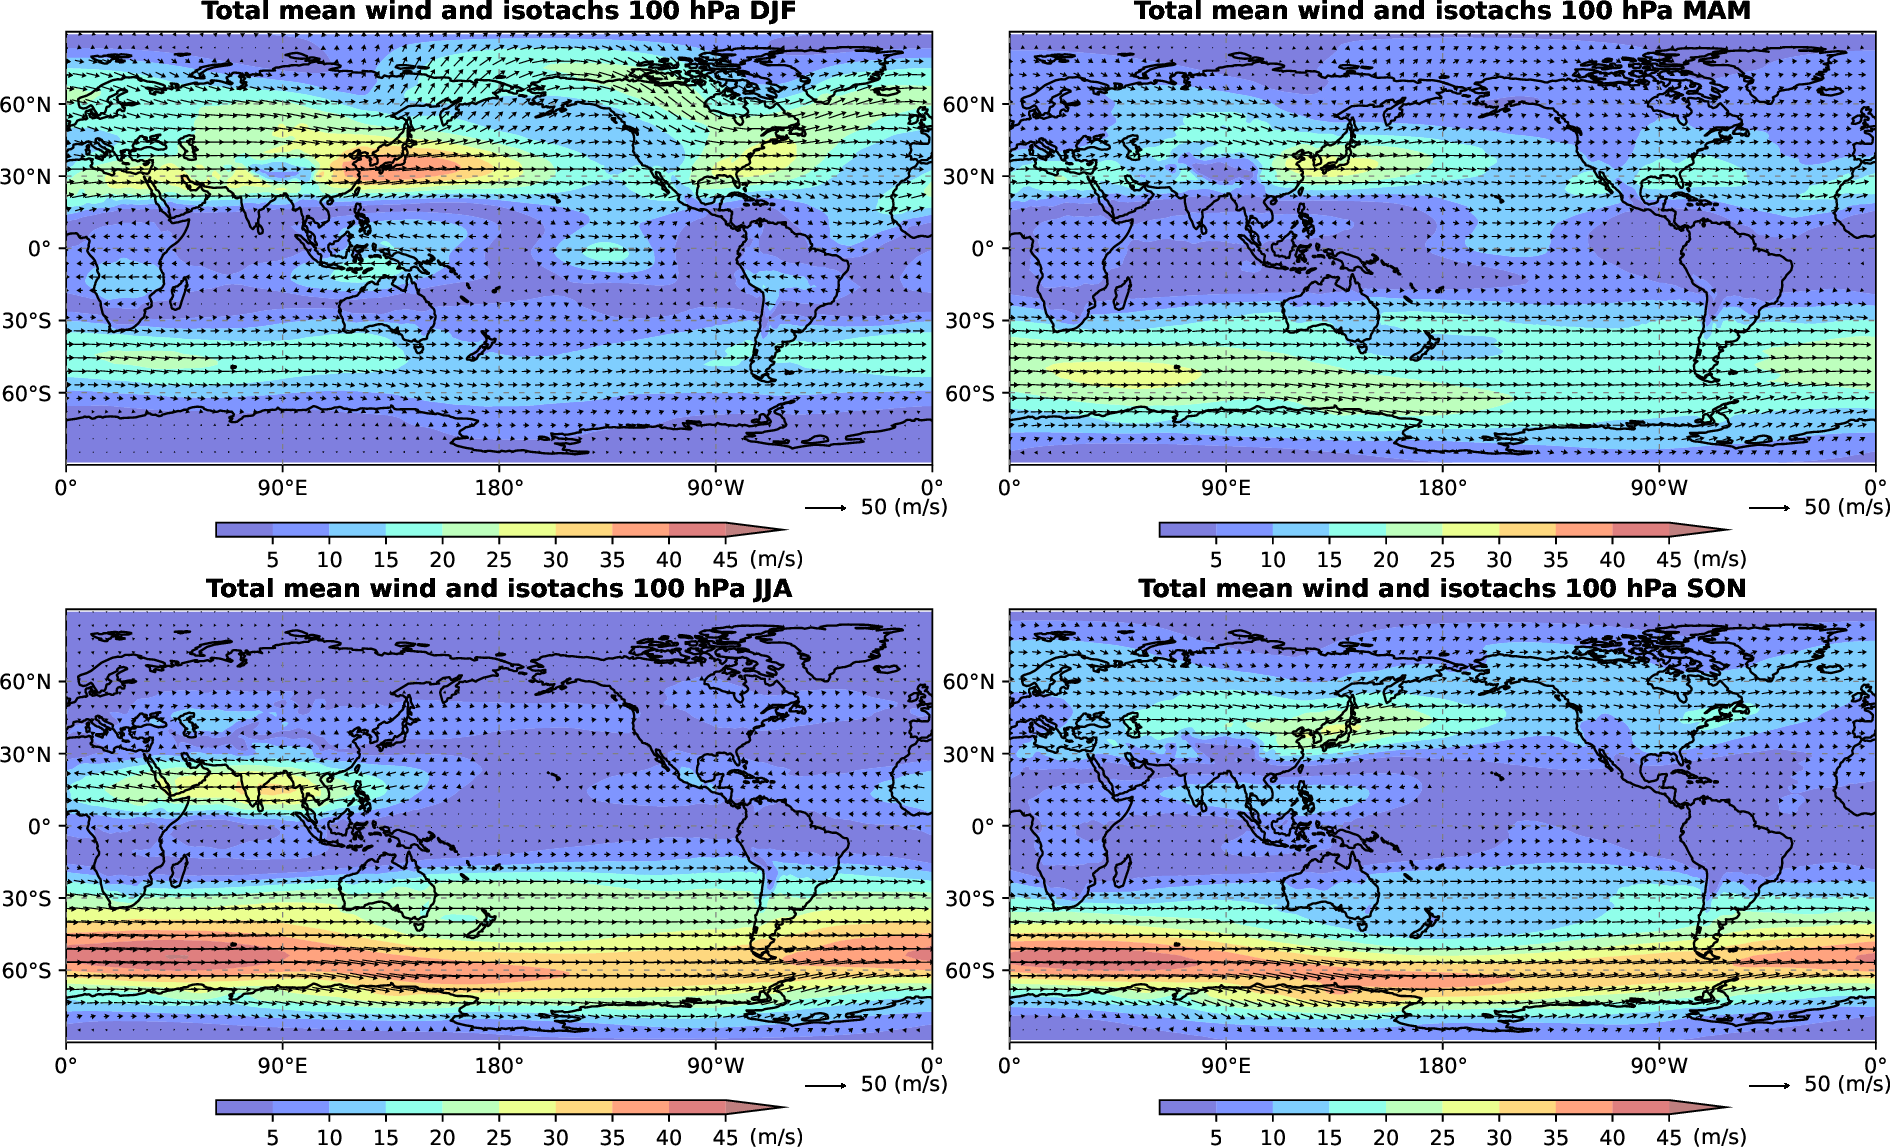
Total Circulation
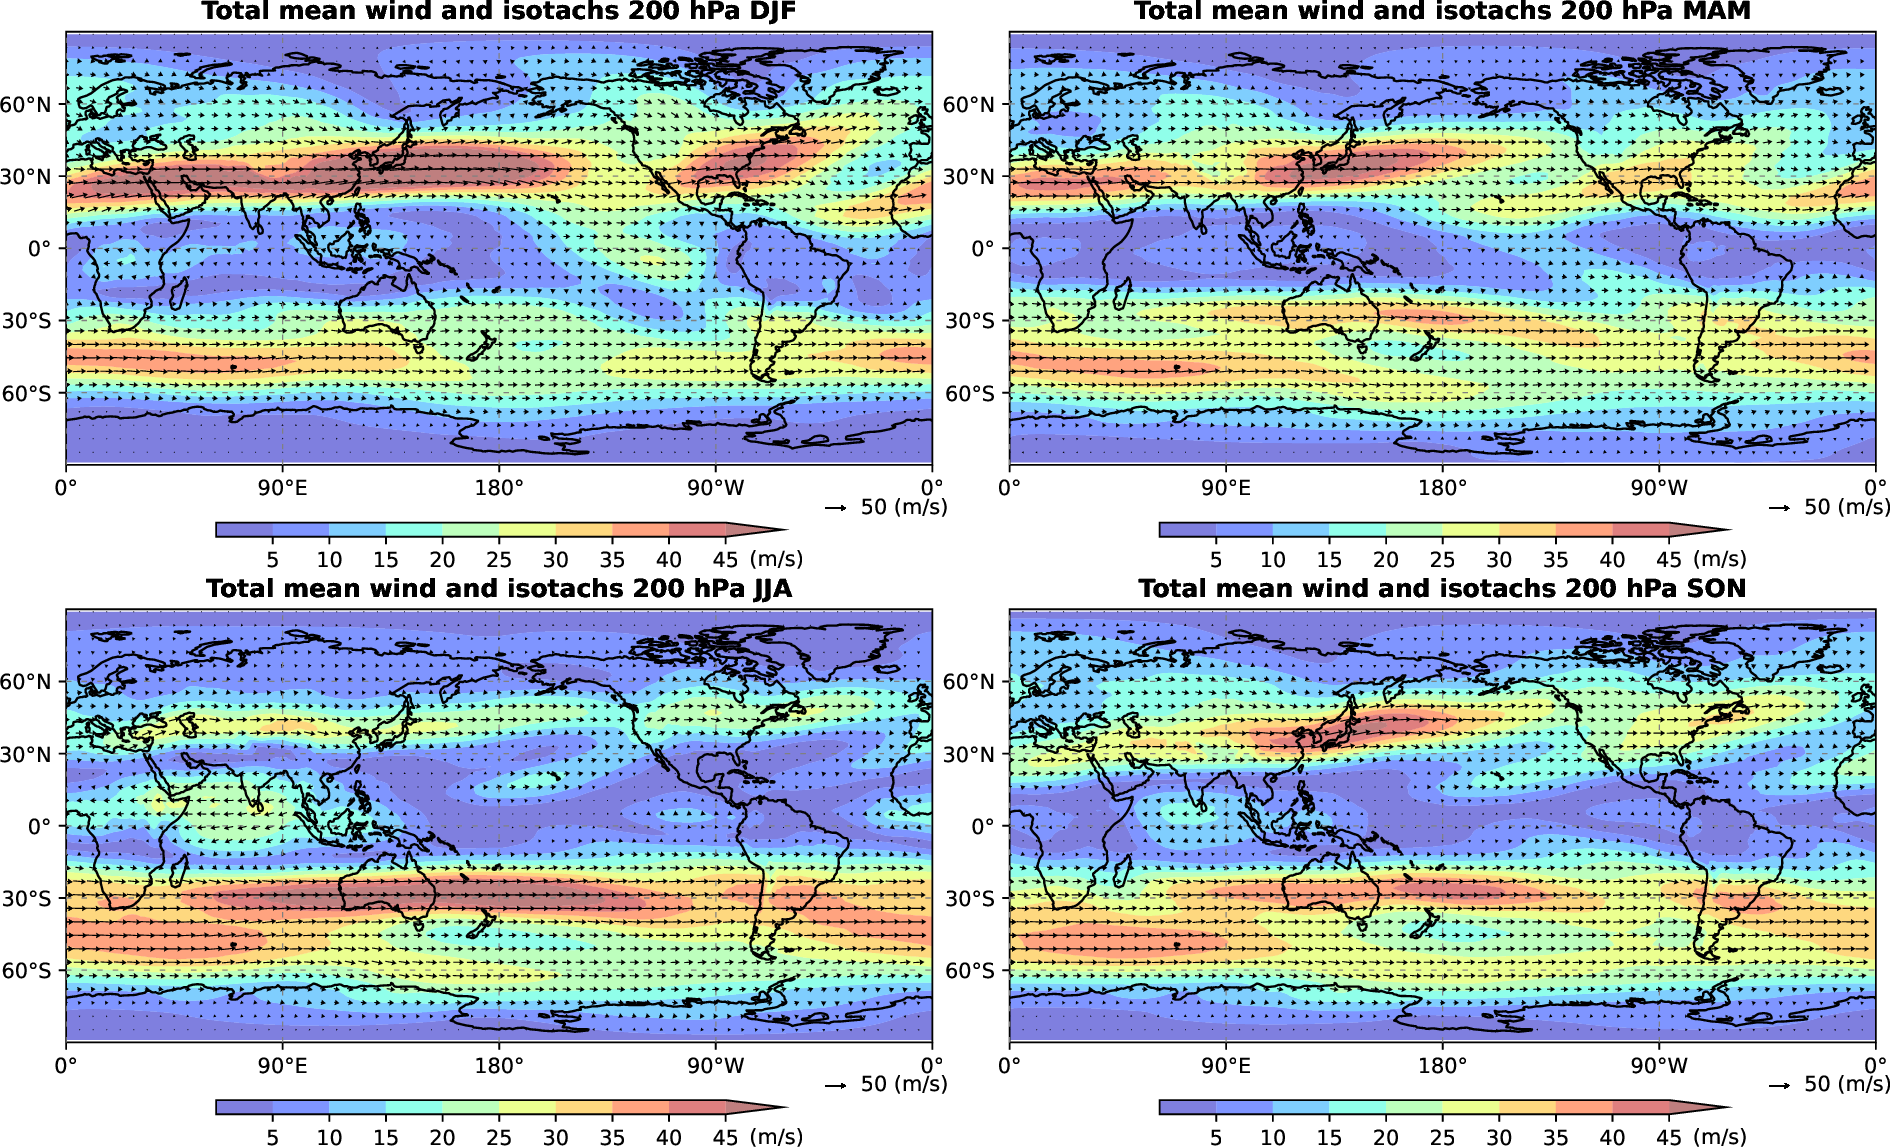
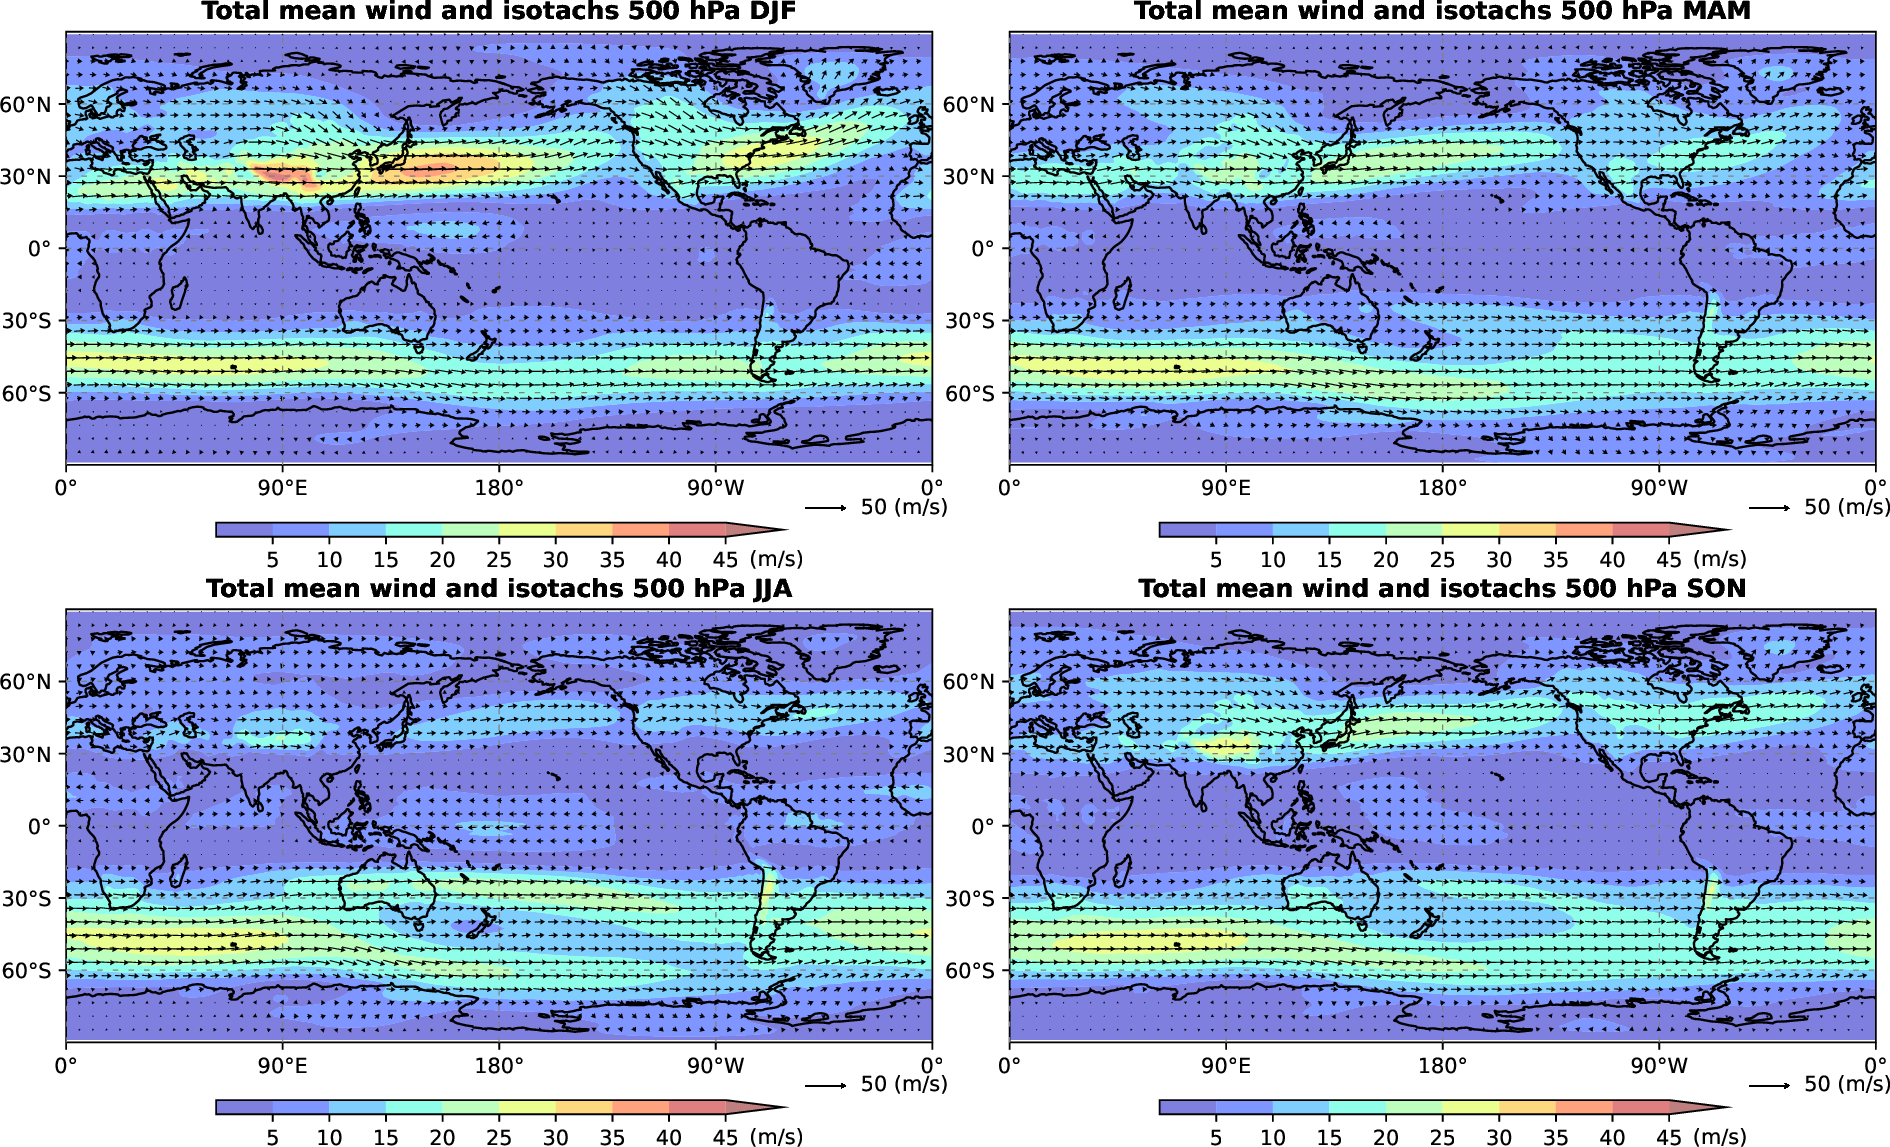
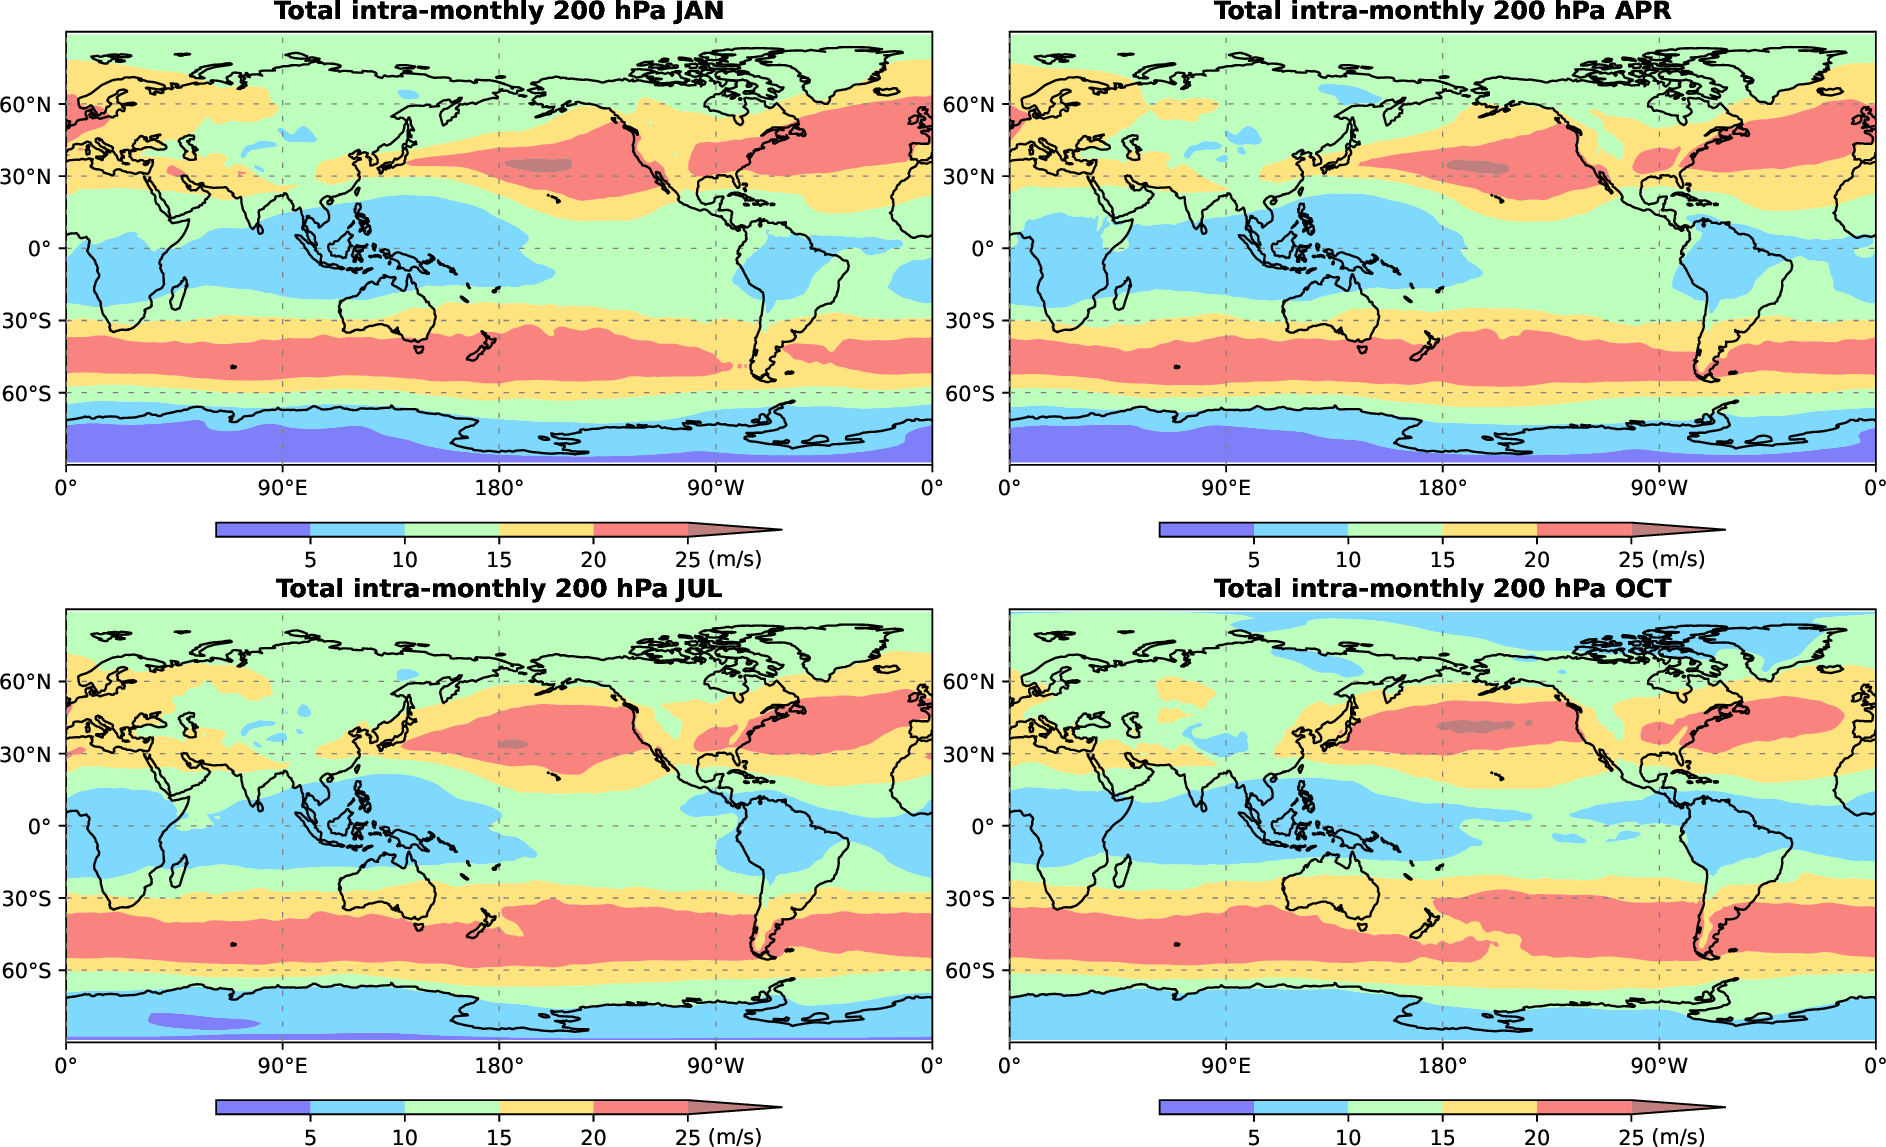
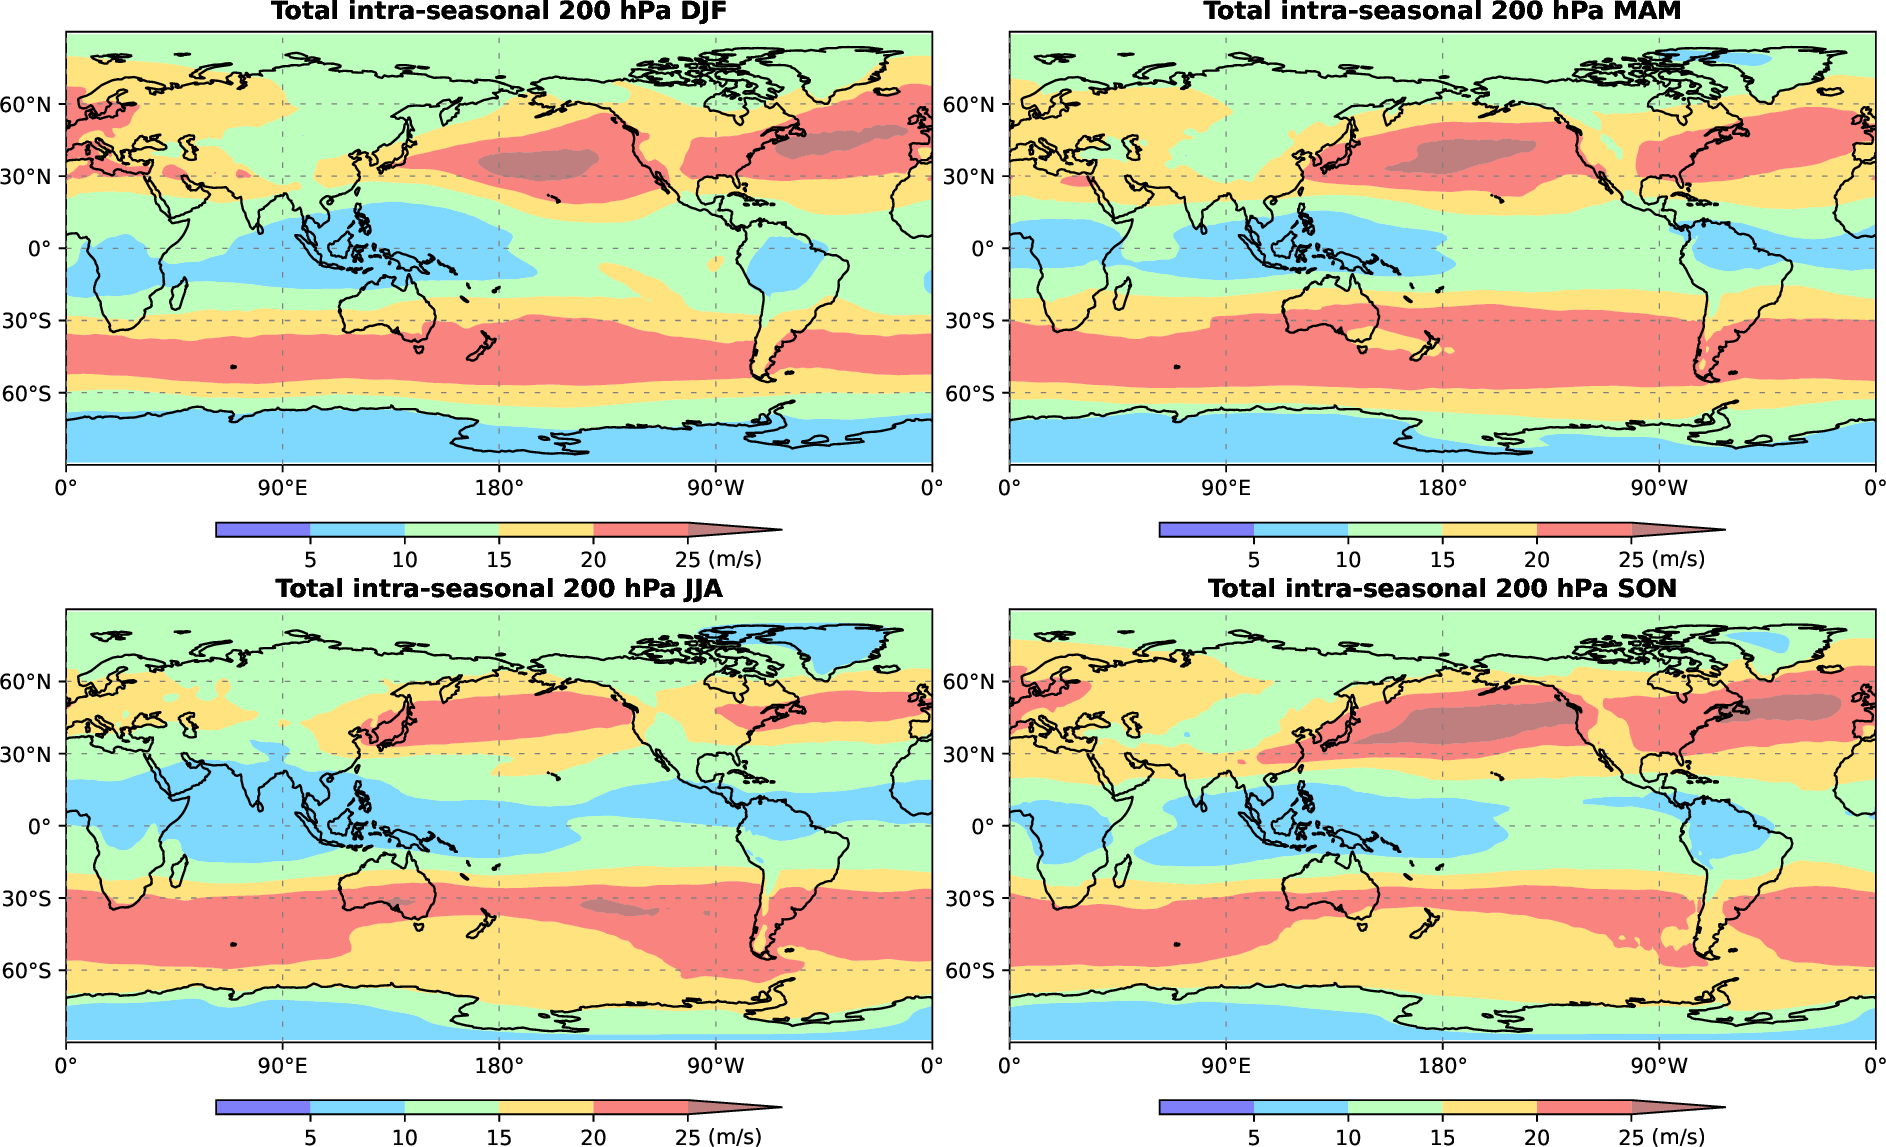
Climatological (1980-2019) seasonal averages of the horizontal wind (vectors and Isotachs) for sigma levels close to 1, 10, 100, 200 and 500 hPa. The winds were obtained by summation of all modes.
| Seasonal mean zonal wind 1 hPa | Seasonal mean zonal wind 10 hPa | Seasonal mean zonal wind 100 hPa | Seasonal mean zonal wind 200 hPa | Seasonal mean zonal wind 500 hPa |
 |
 |
 |
 |
 |
| Intra-monthly variability zonal wind 200 hPa | Intra-seasonal variability zonal wind 200 hPa |
 |
 |
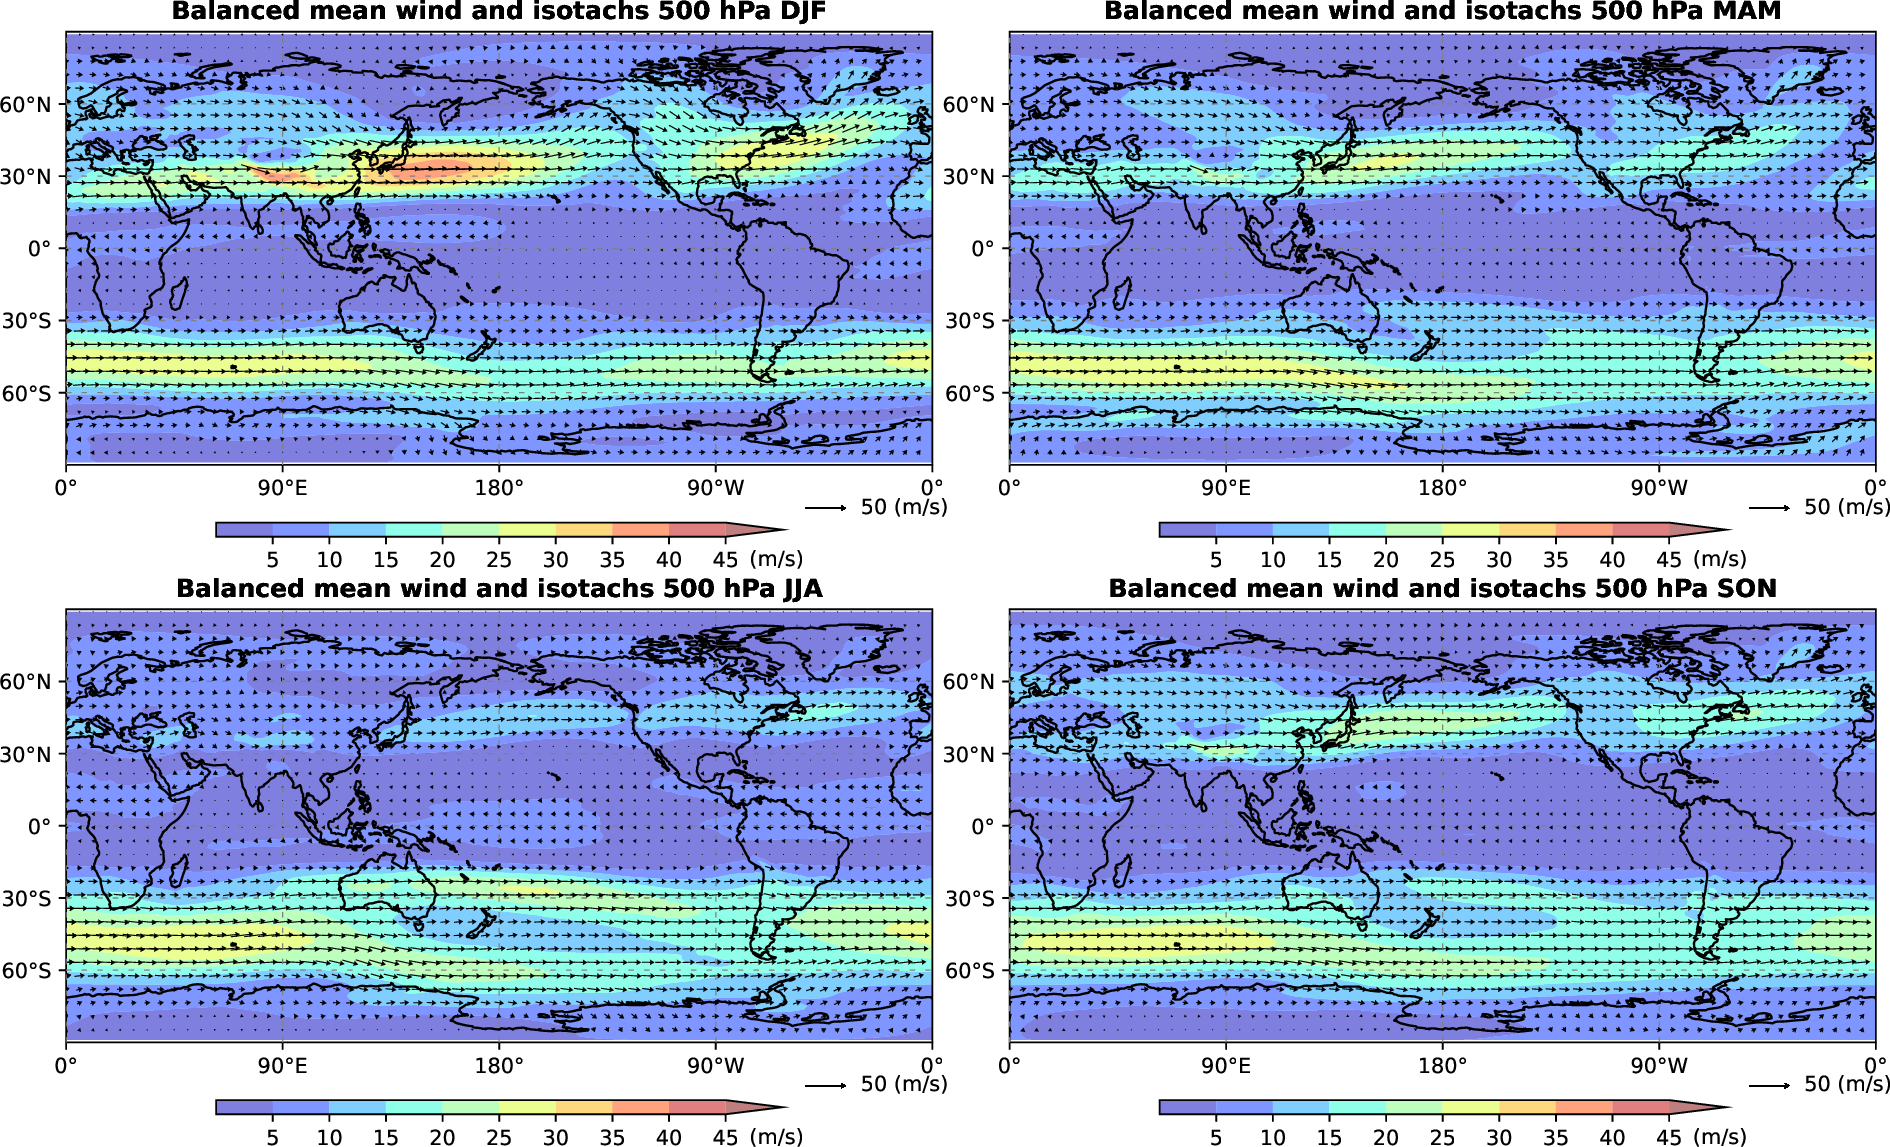
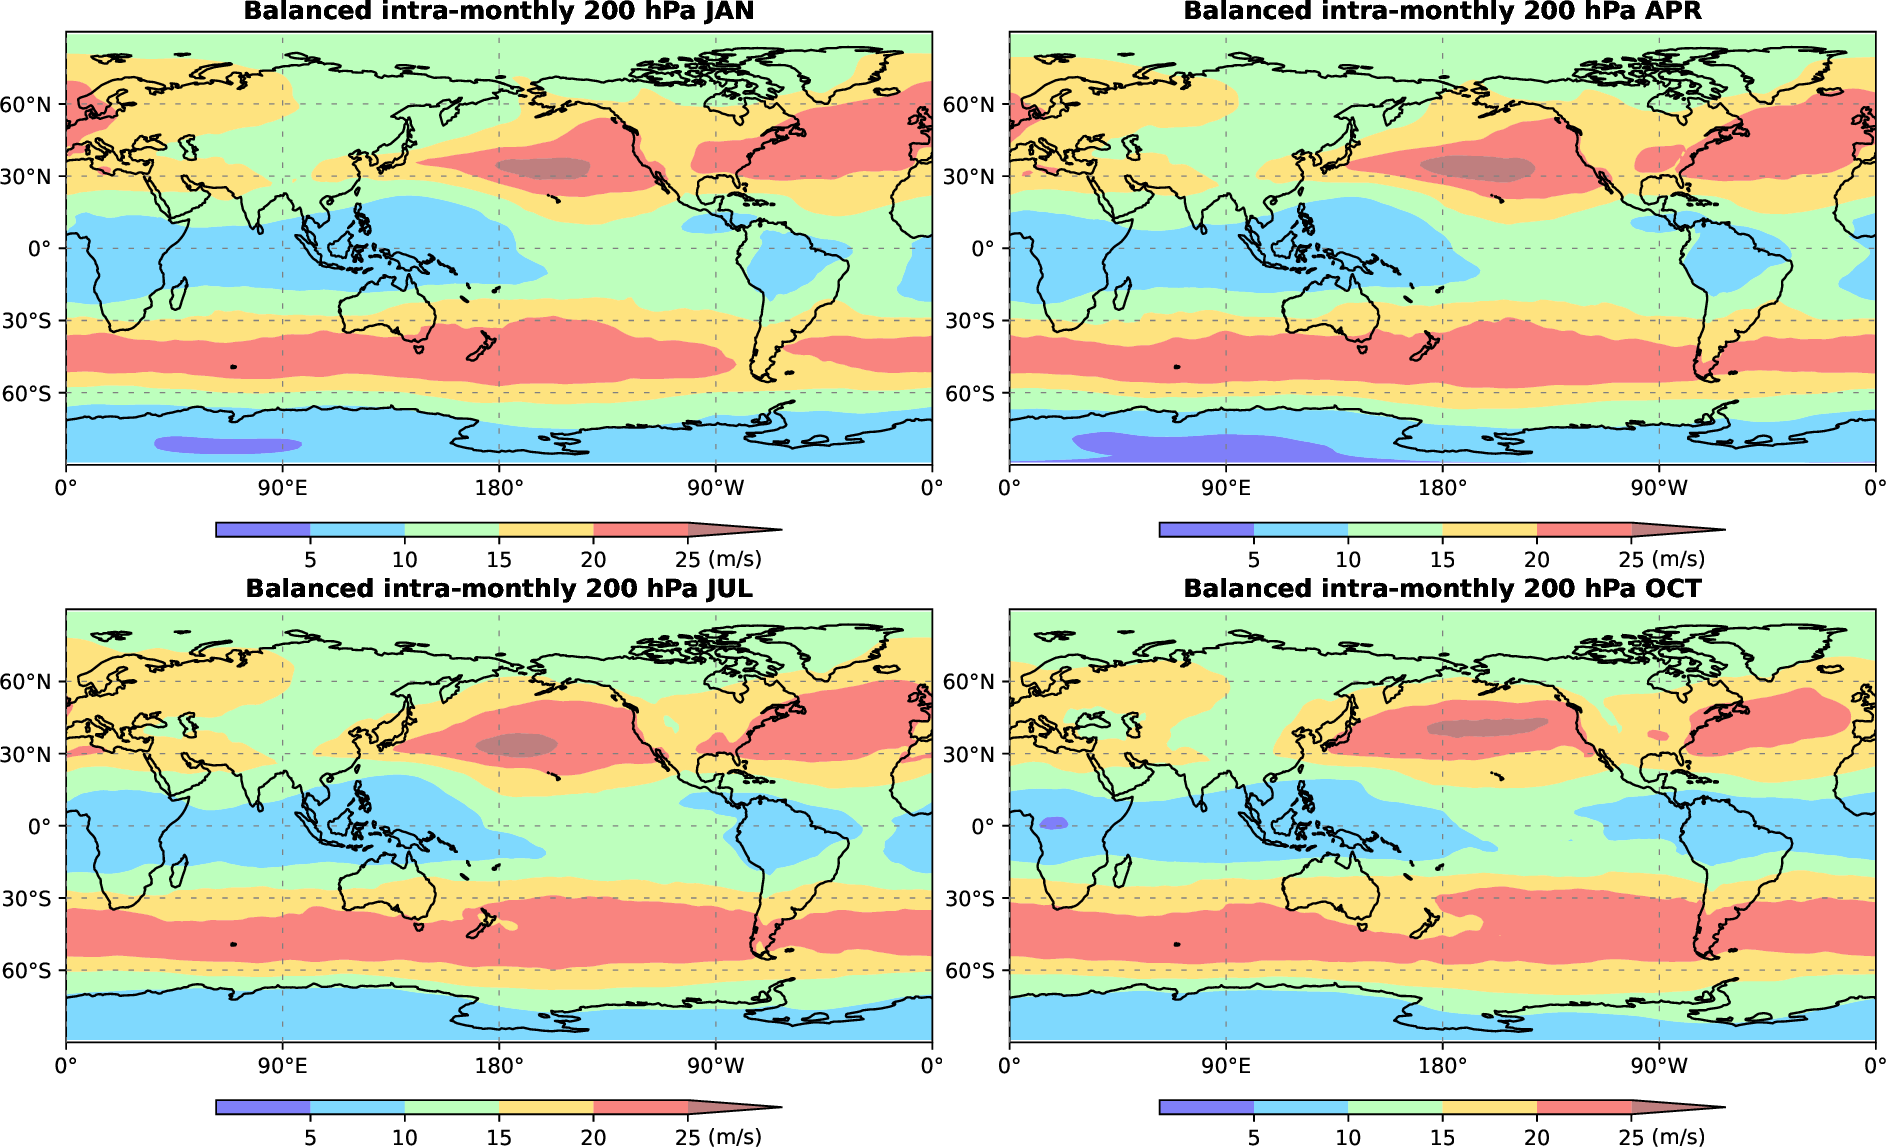
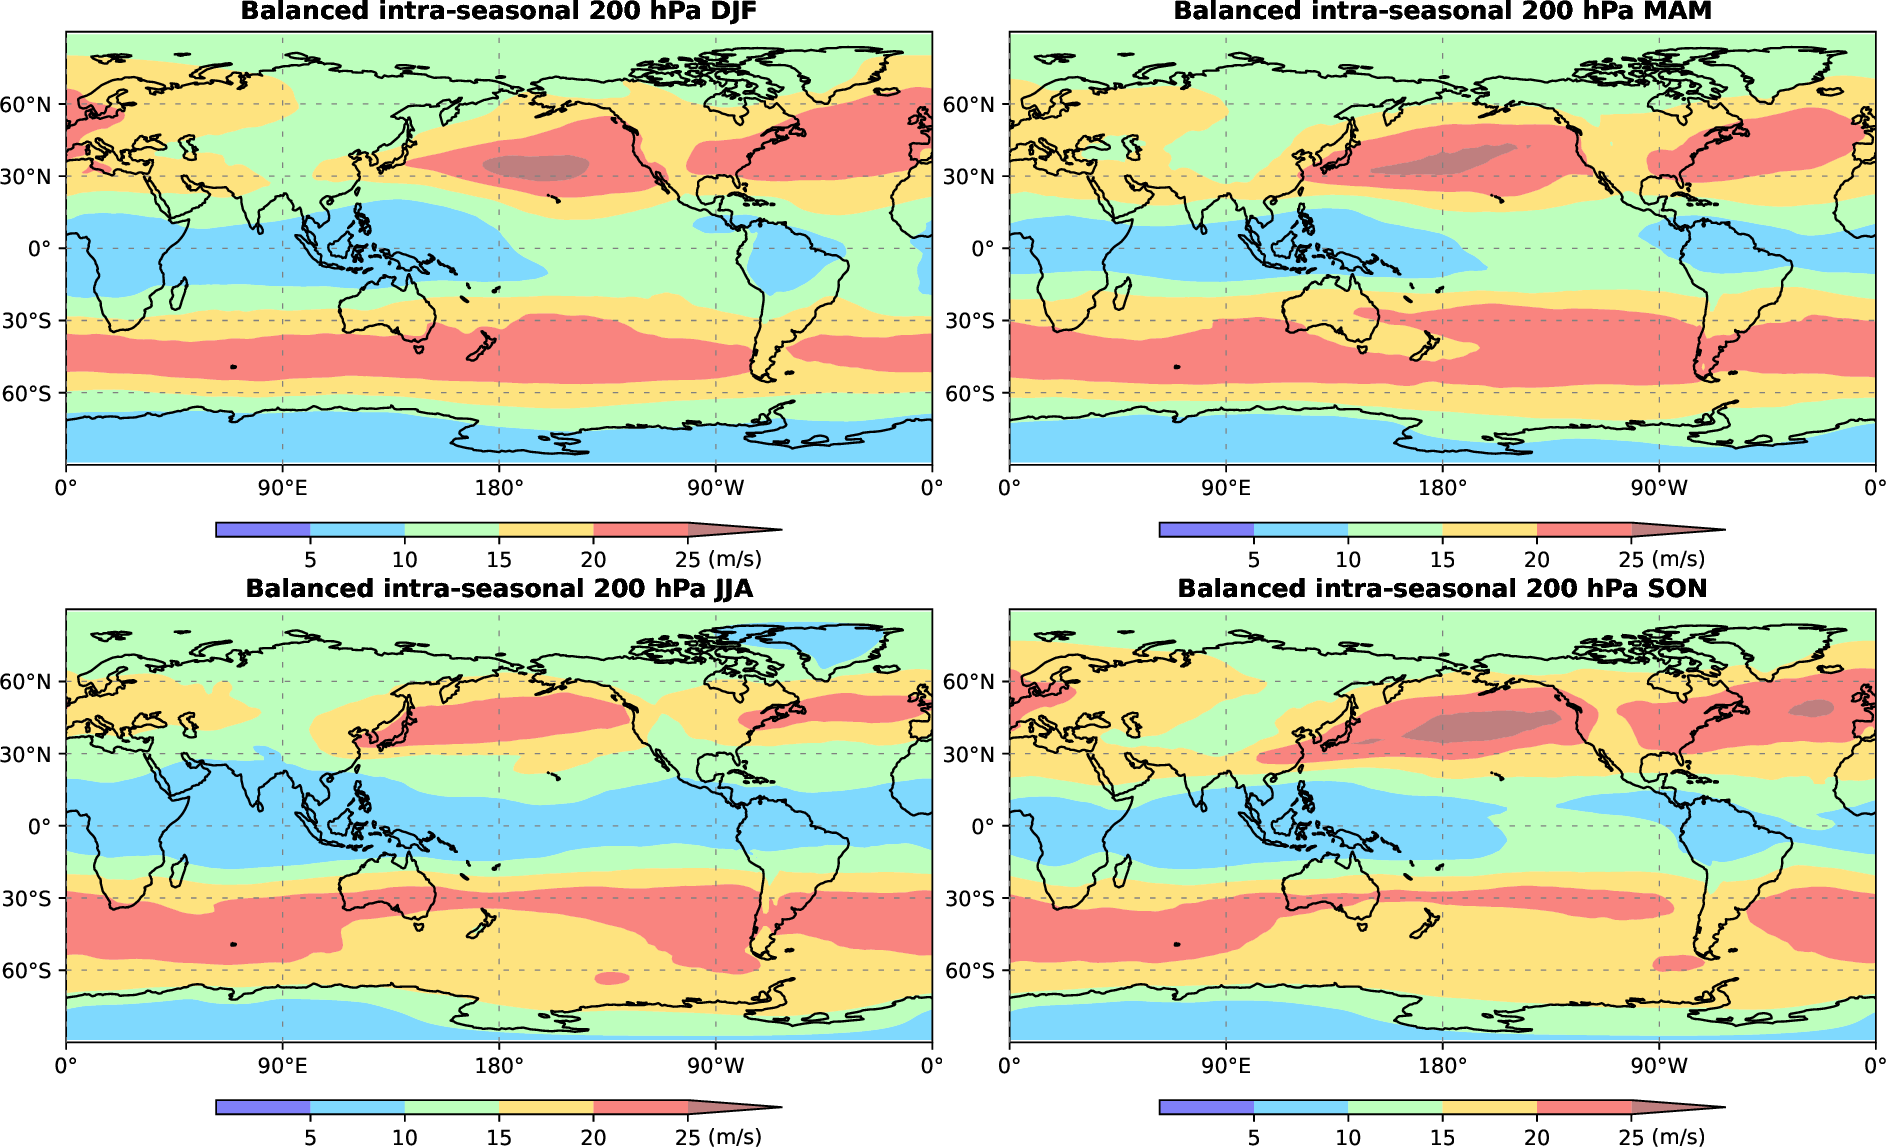
Balanced circulation
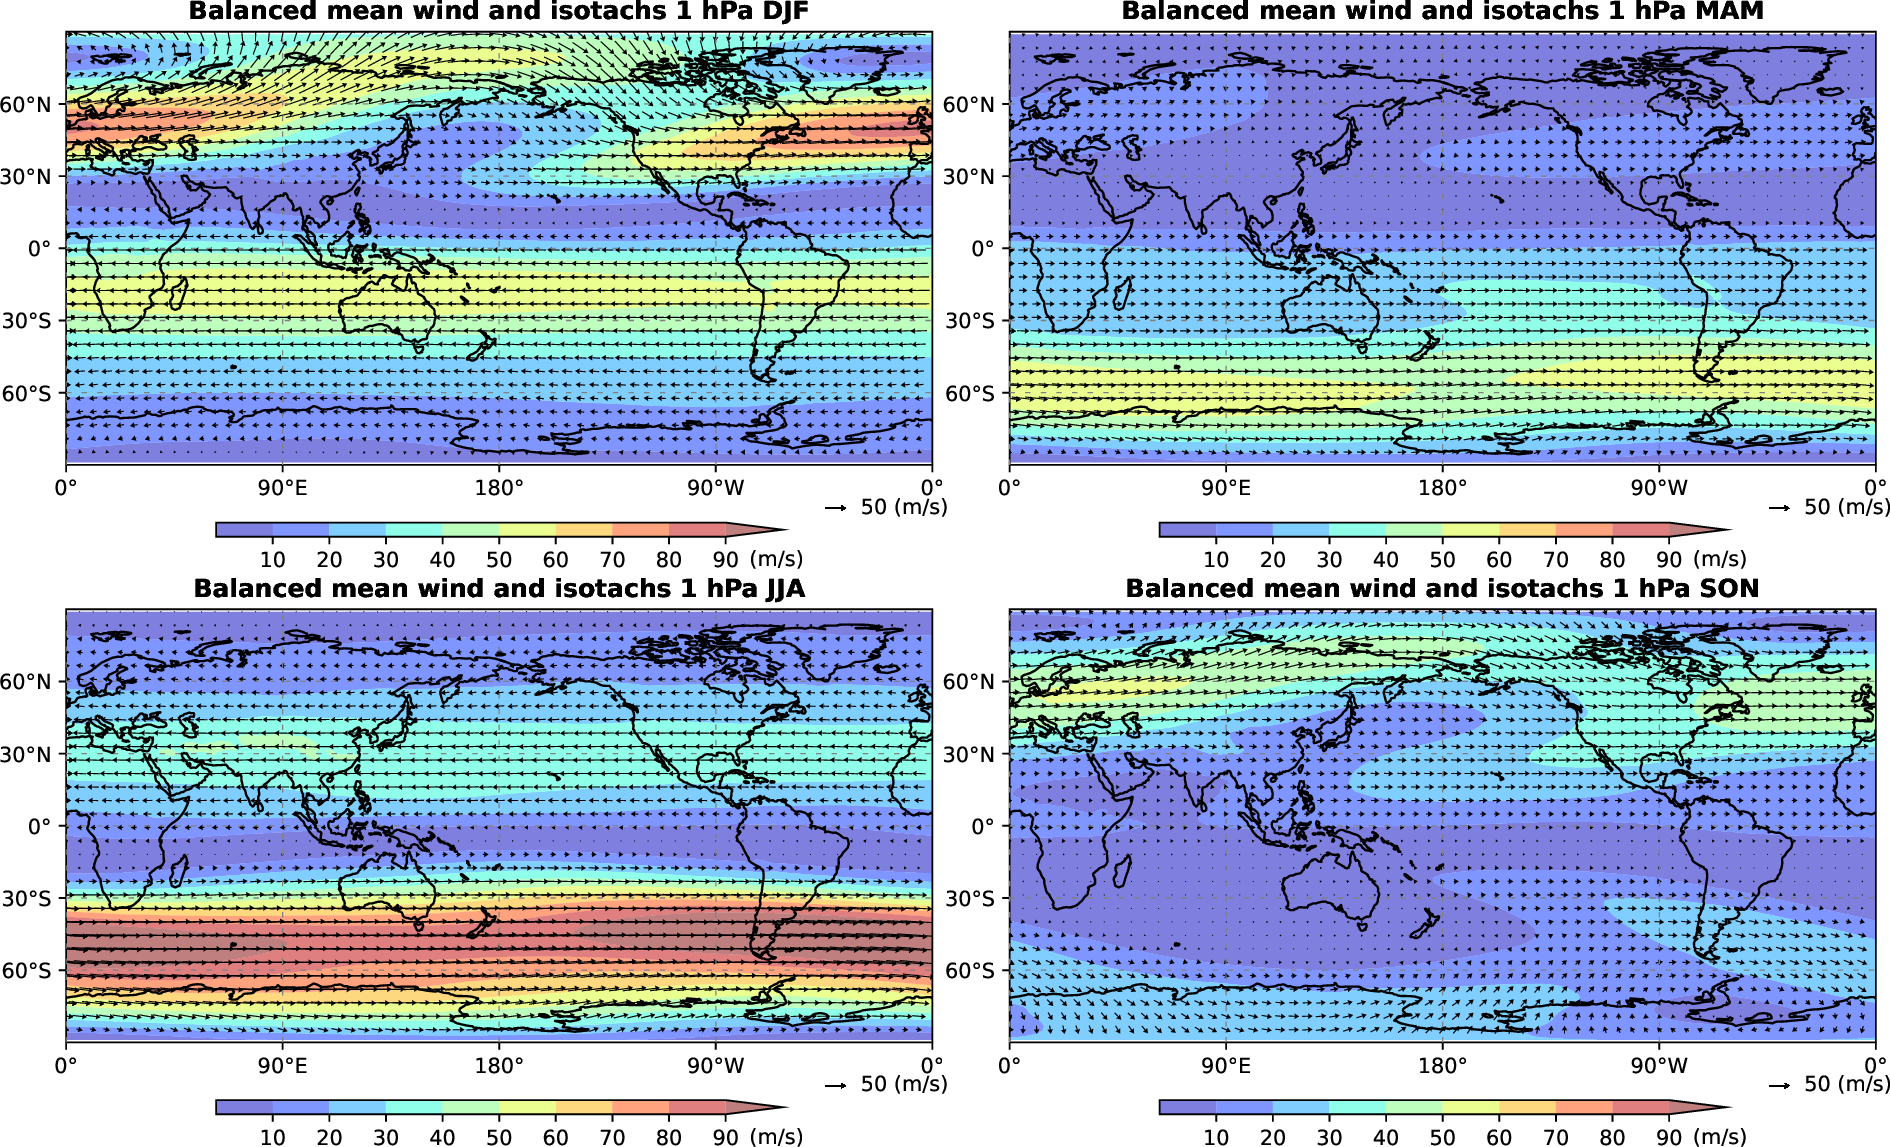
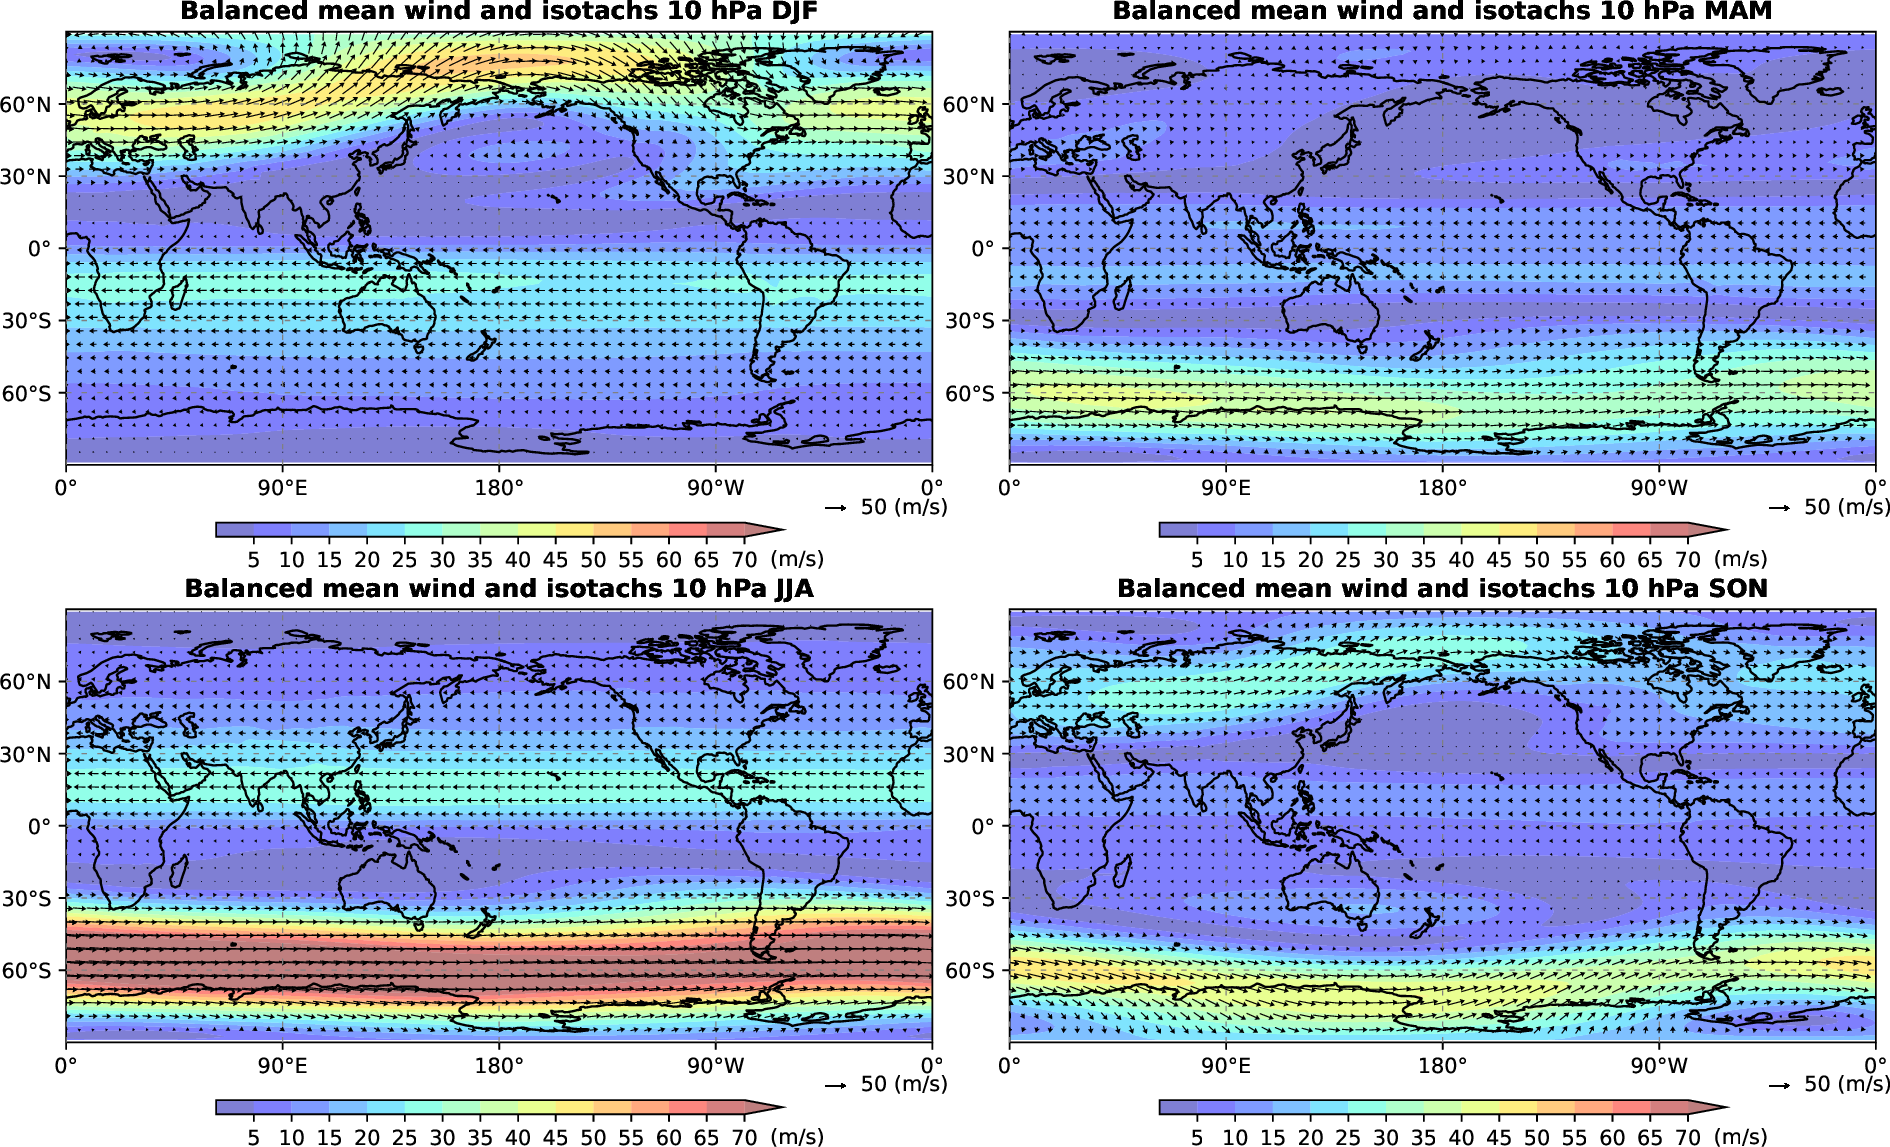
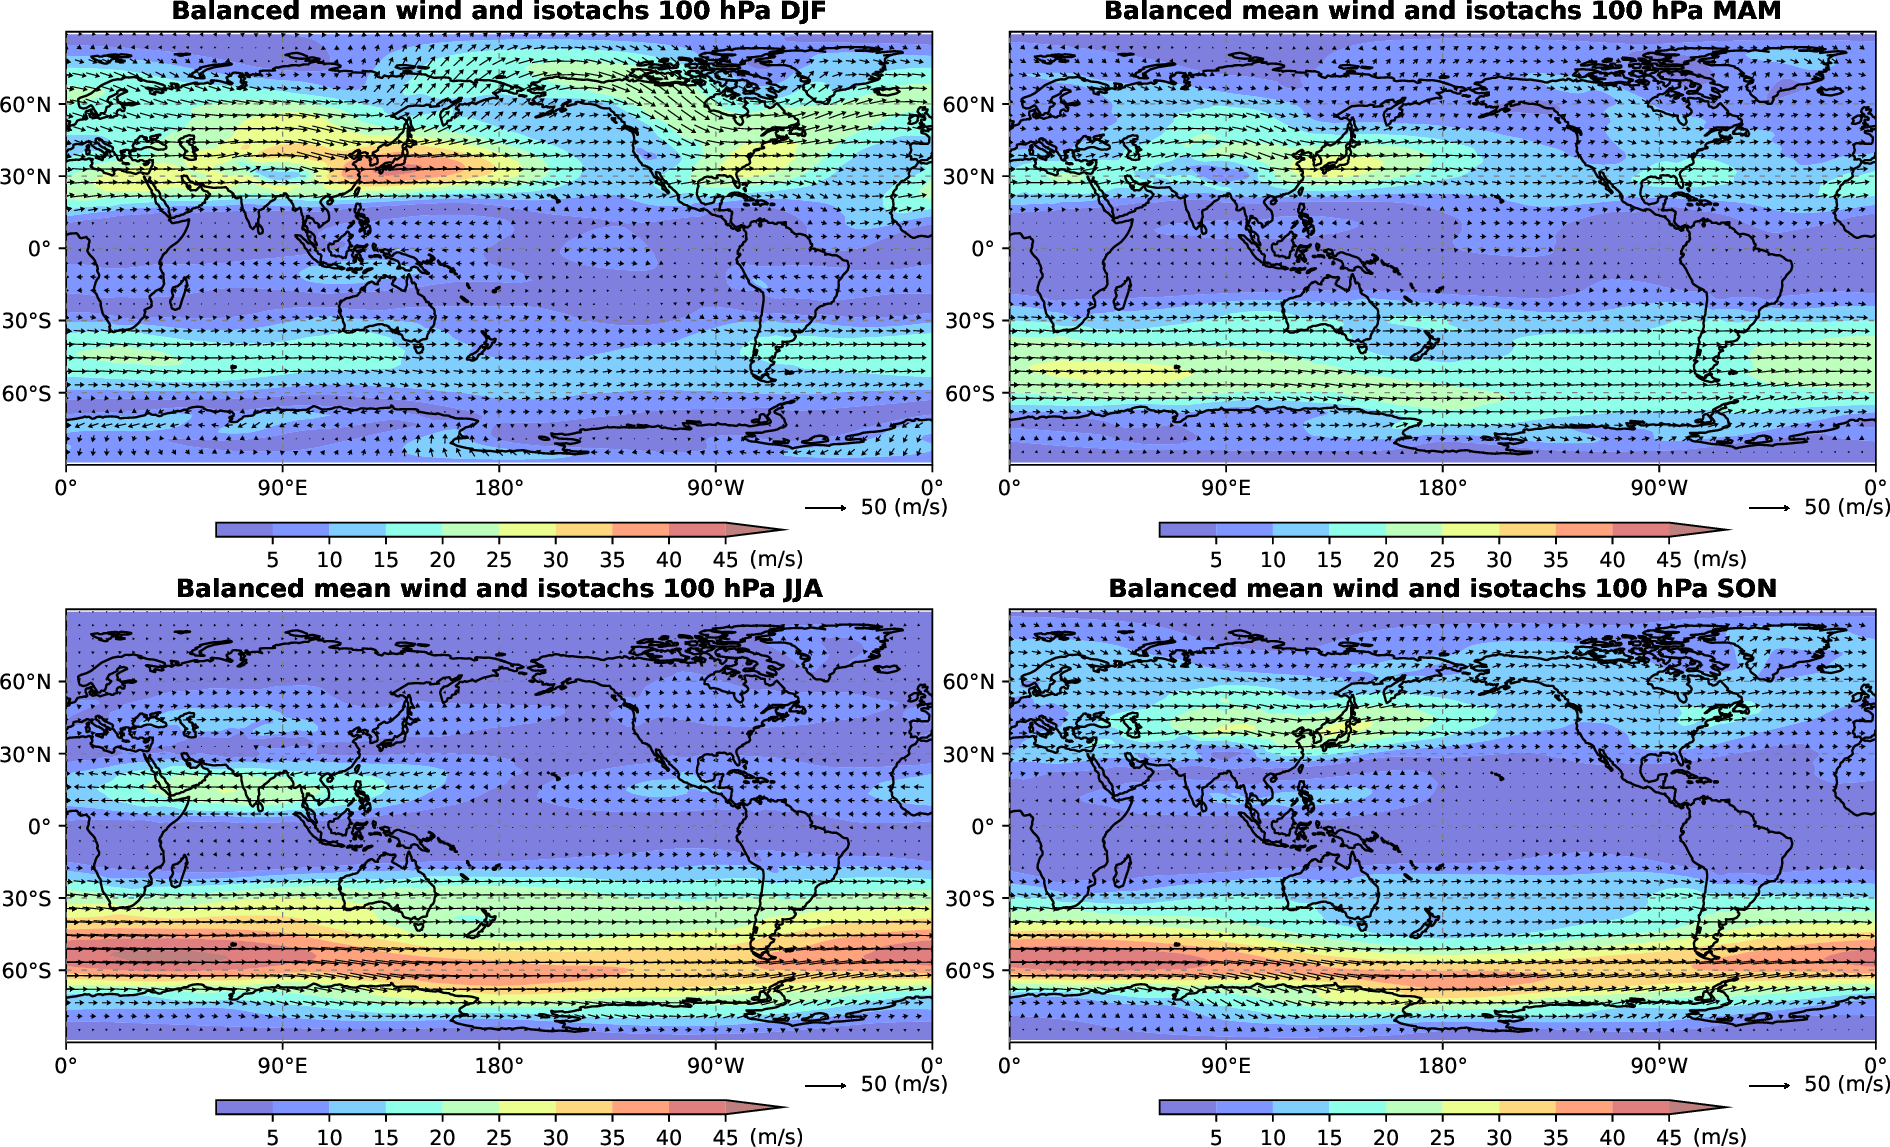
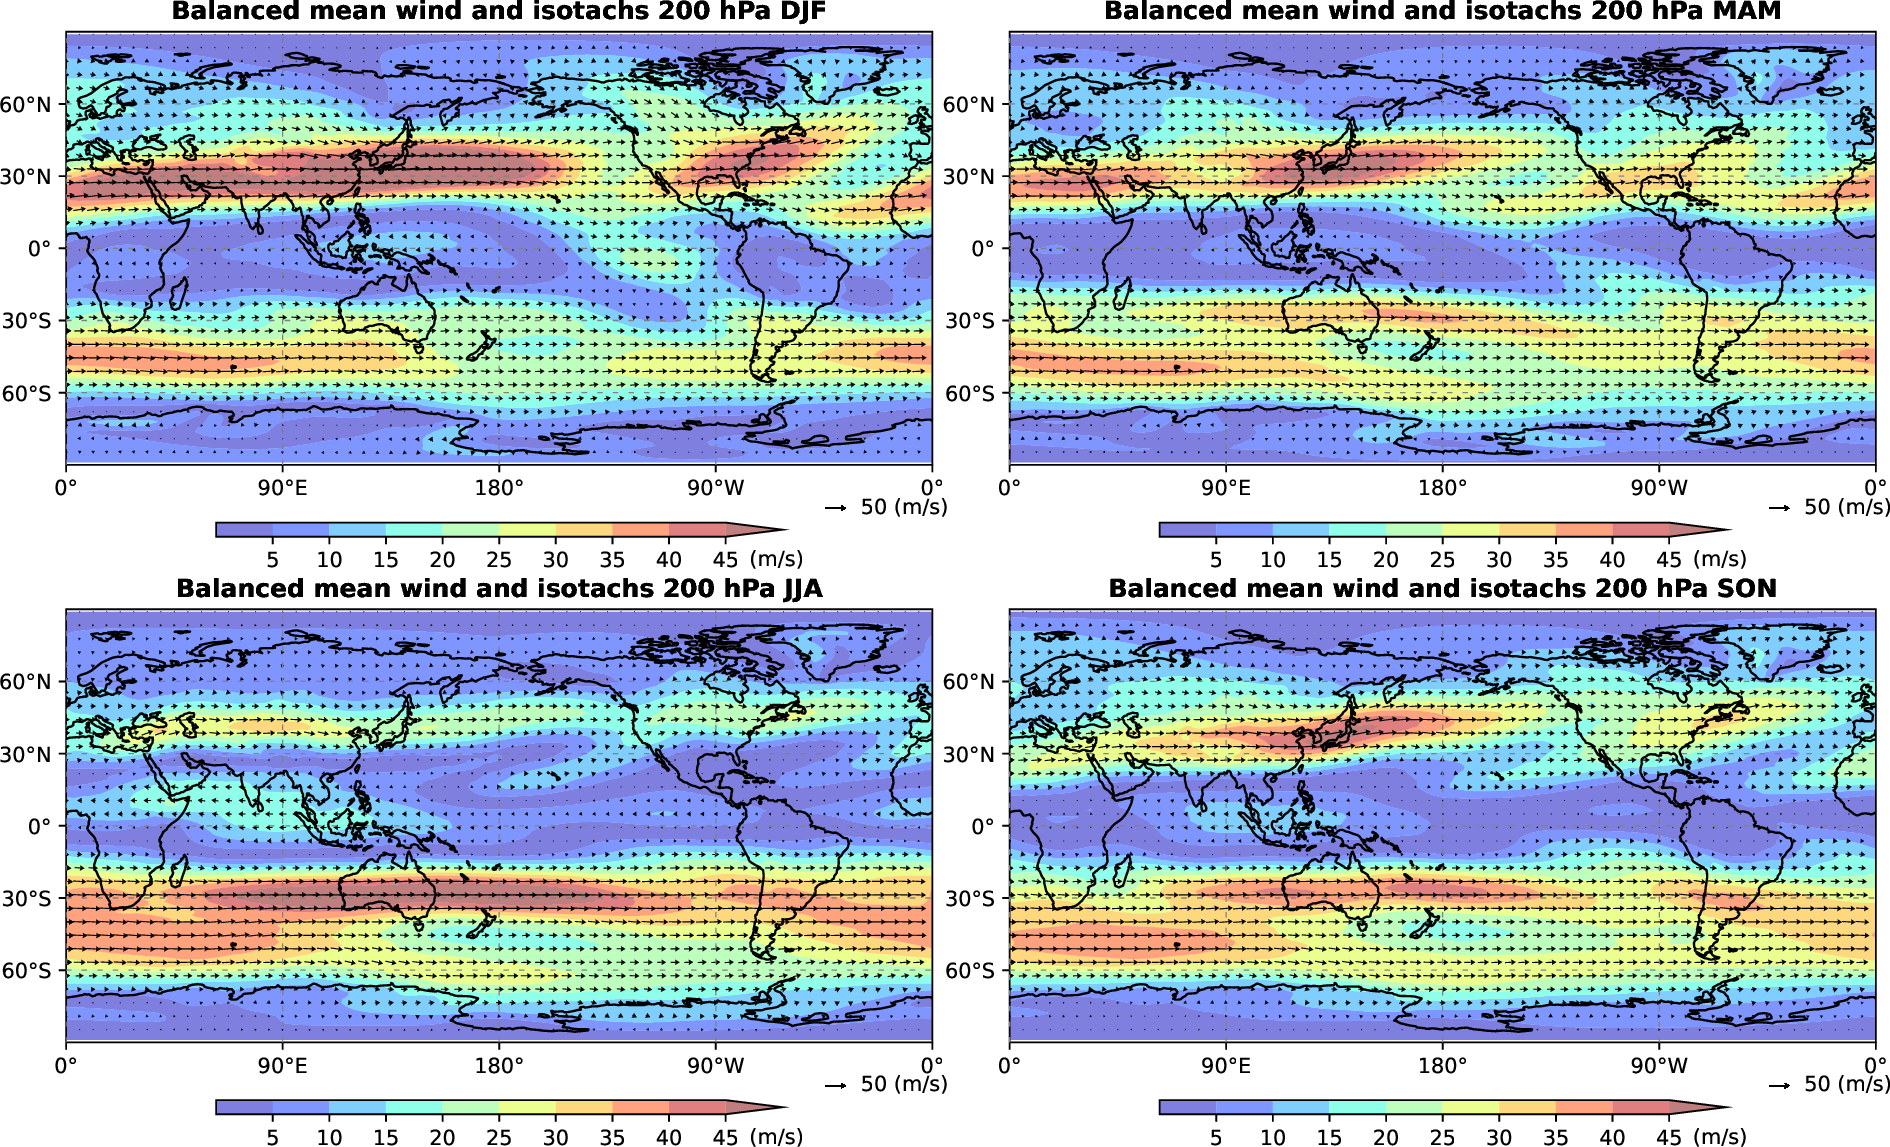
Climatological (1980-2019) seasonal averages of the horizontal wind (vectors and Isotachs) at sigma levels close to 1, 10, 100, 200 and 500 hPa. The winds were obtained by summation of all linearly balanced (Rossby and mixed Rossby gravity) modes.
| Seasonal mean zonal wind 1 hPa | Seasonal mean zonal wind 10 hPa | Seasonal mean zonal wind 100 hPa | Seasonal mean zonal wind 200 hPa | Seasonal mean zonal wind 500 hPa |
 |
 |
 |
 |
 |
| Intra-monthly variability zonal wind 200 hPa | Intra-seasonal variability zonal wind 200 hPa |
 |
 |
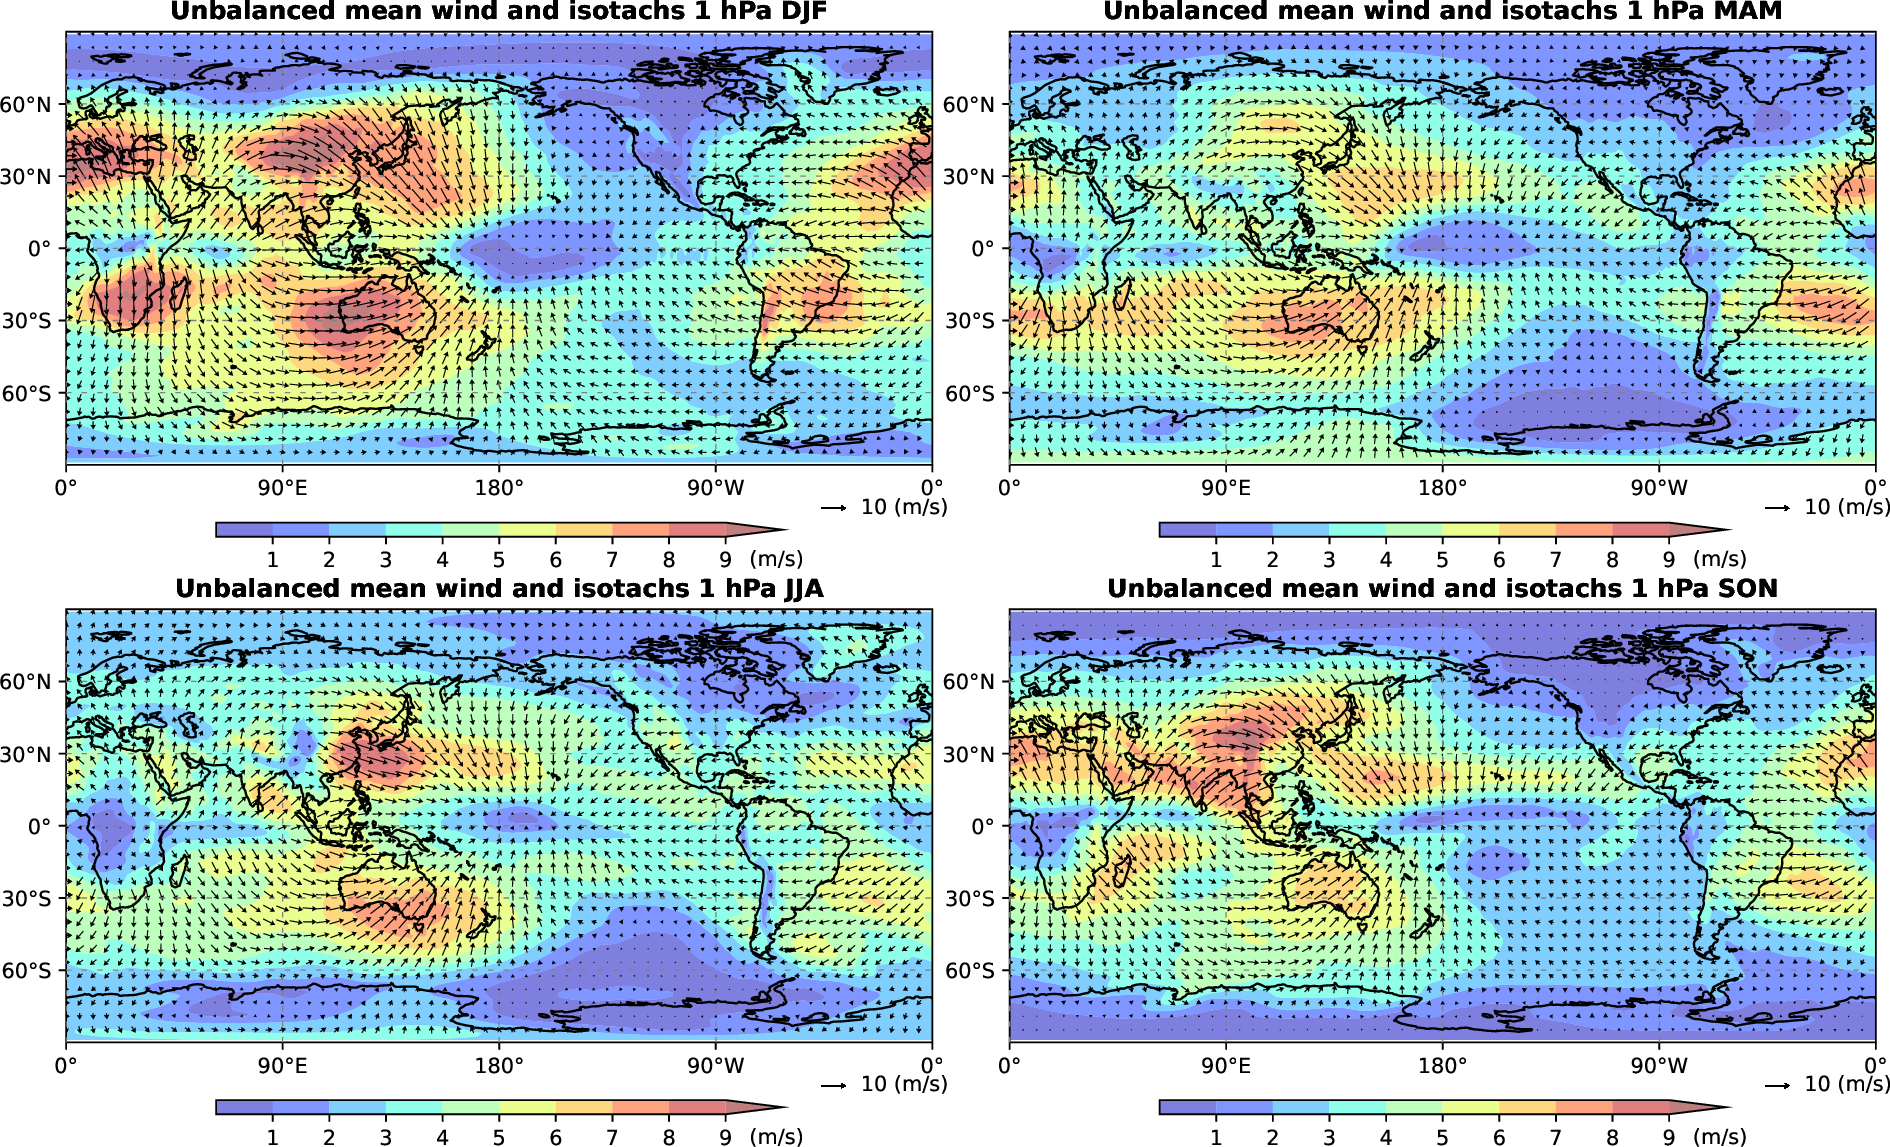
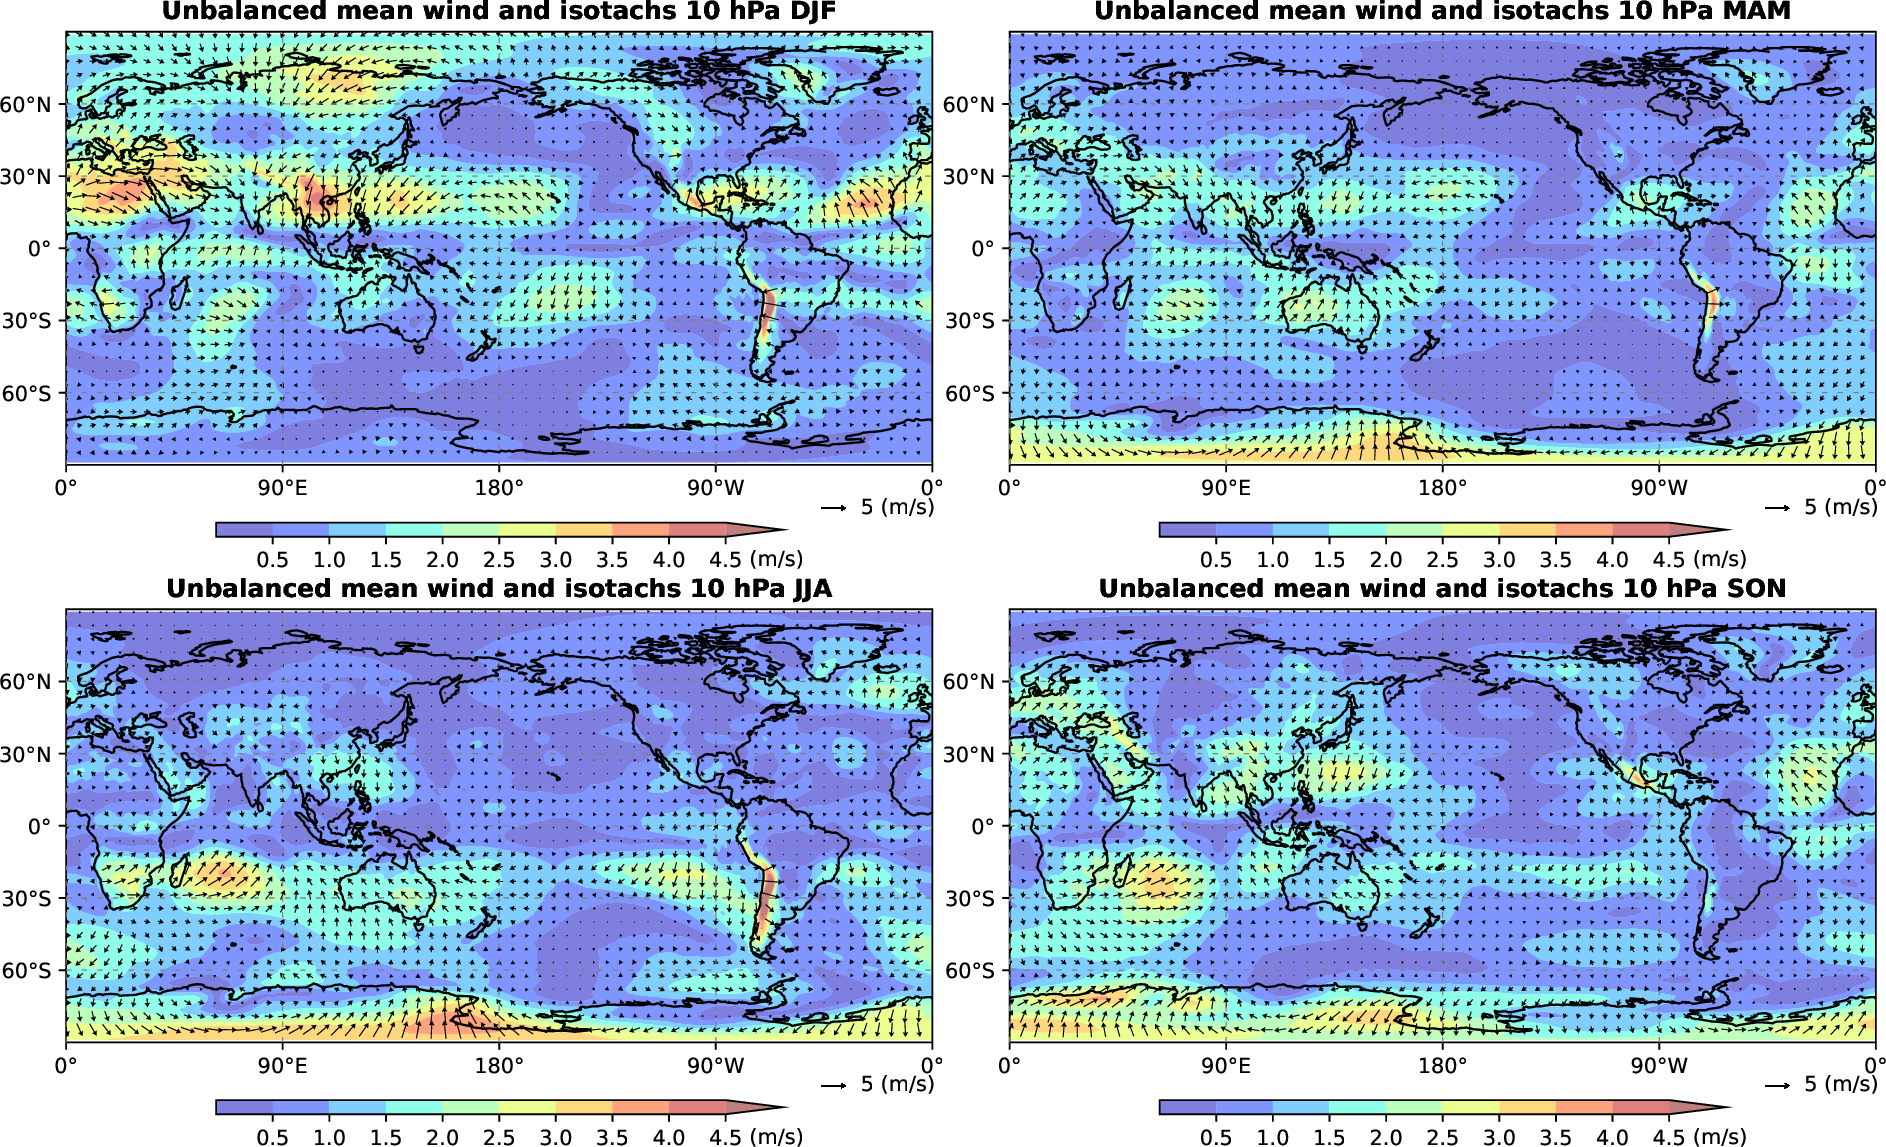
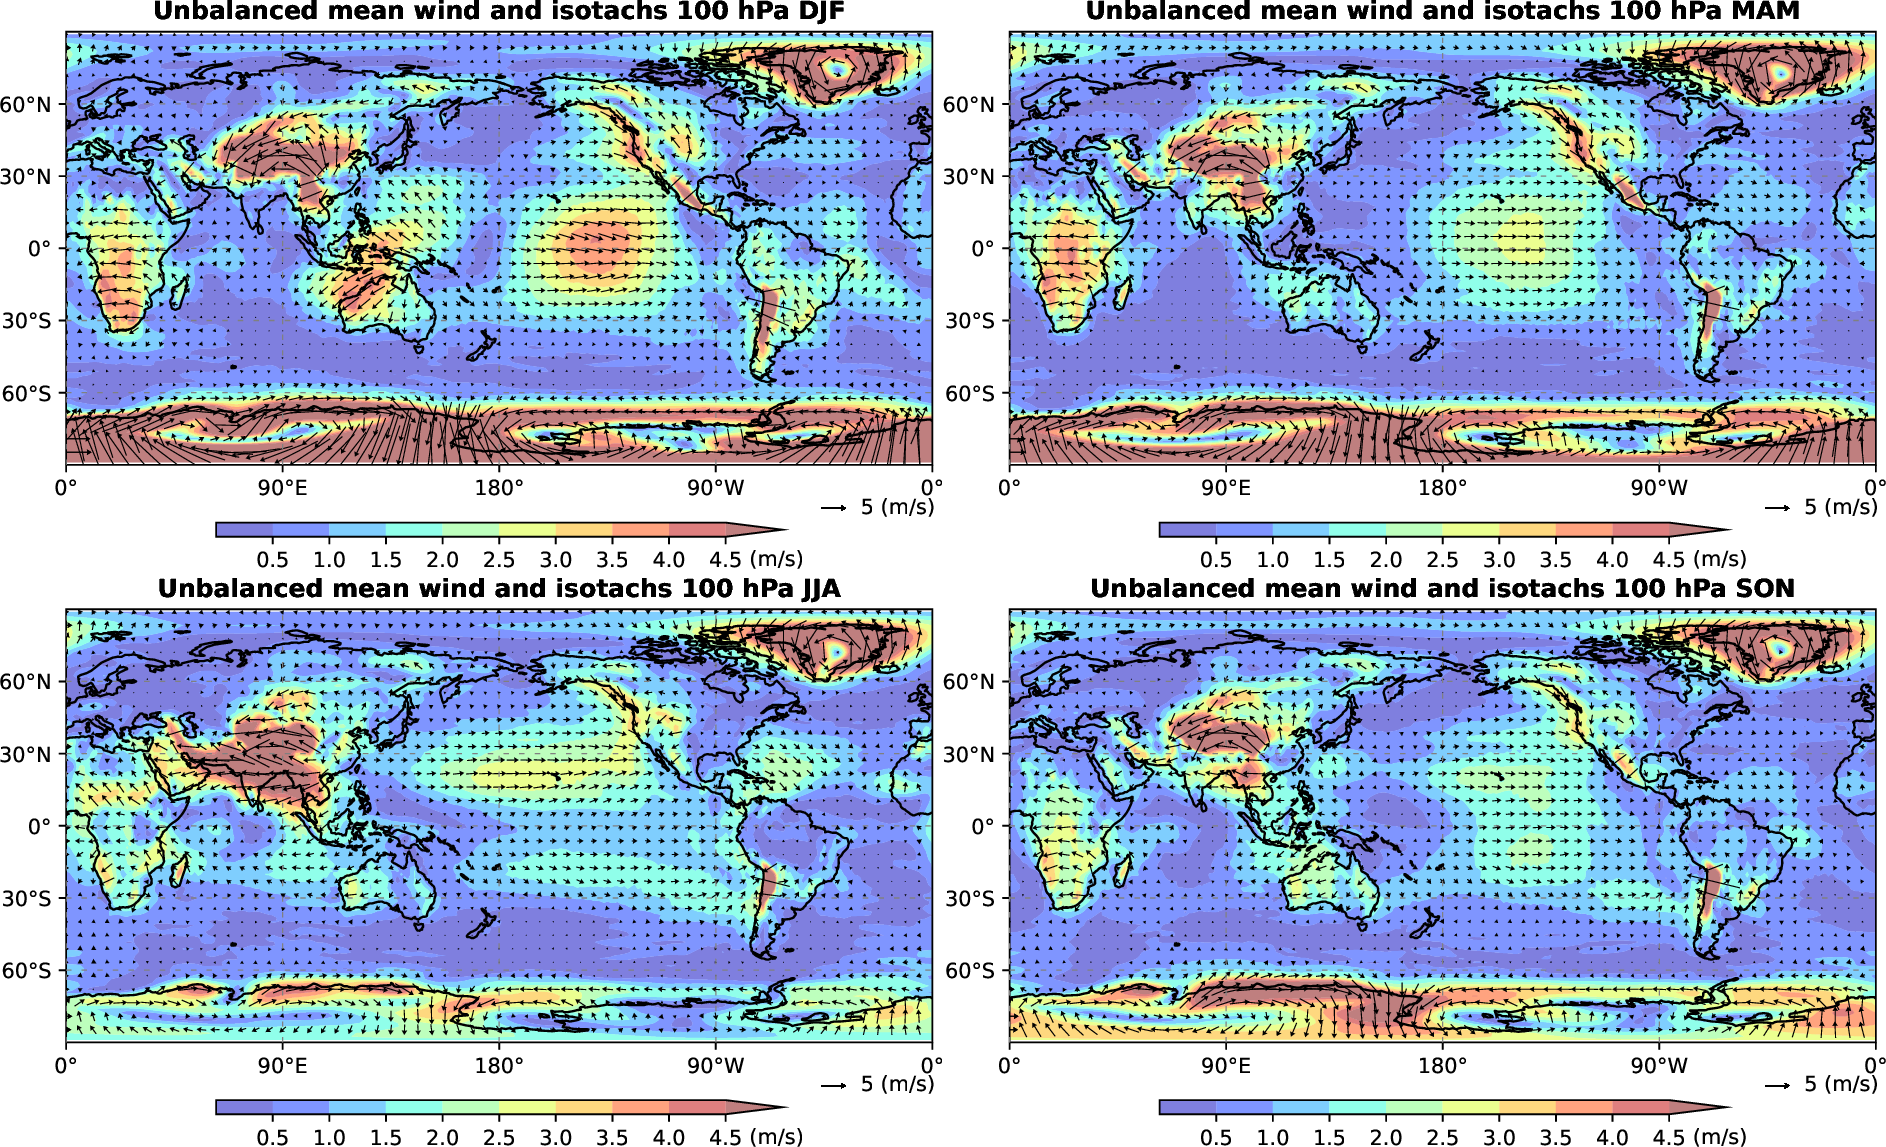
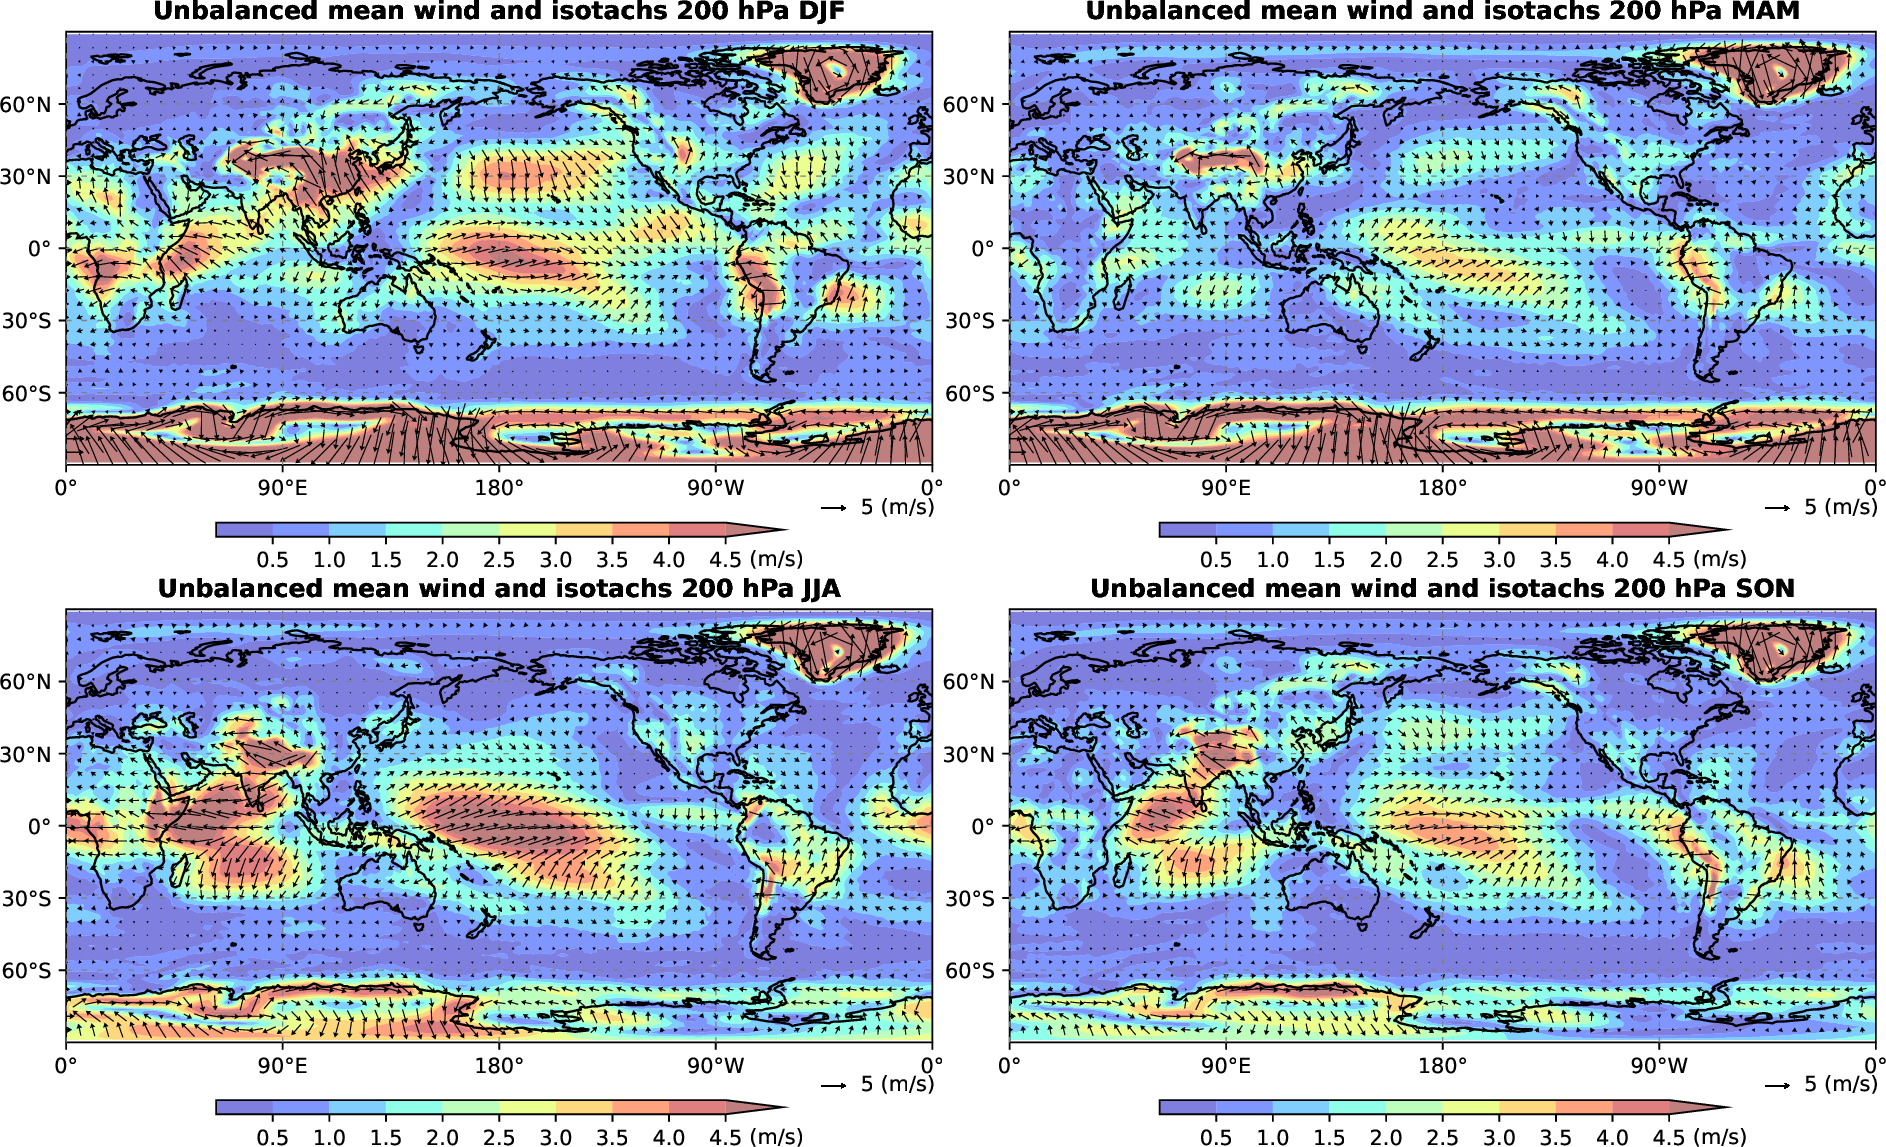
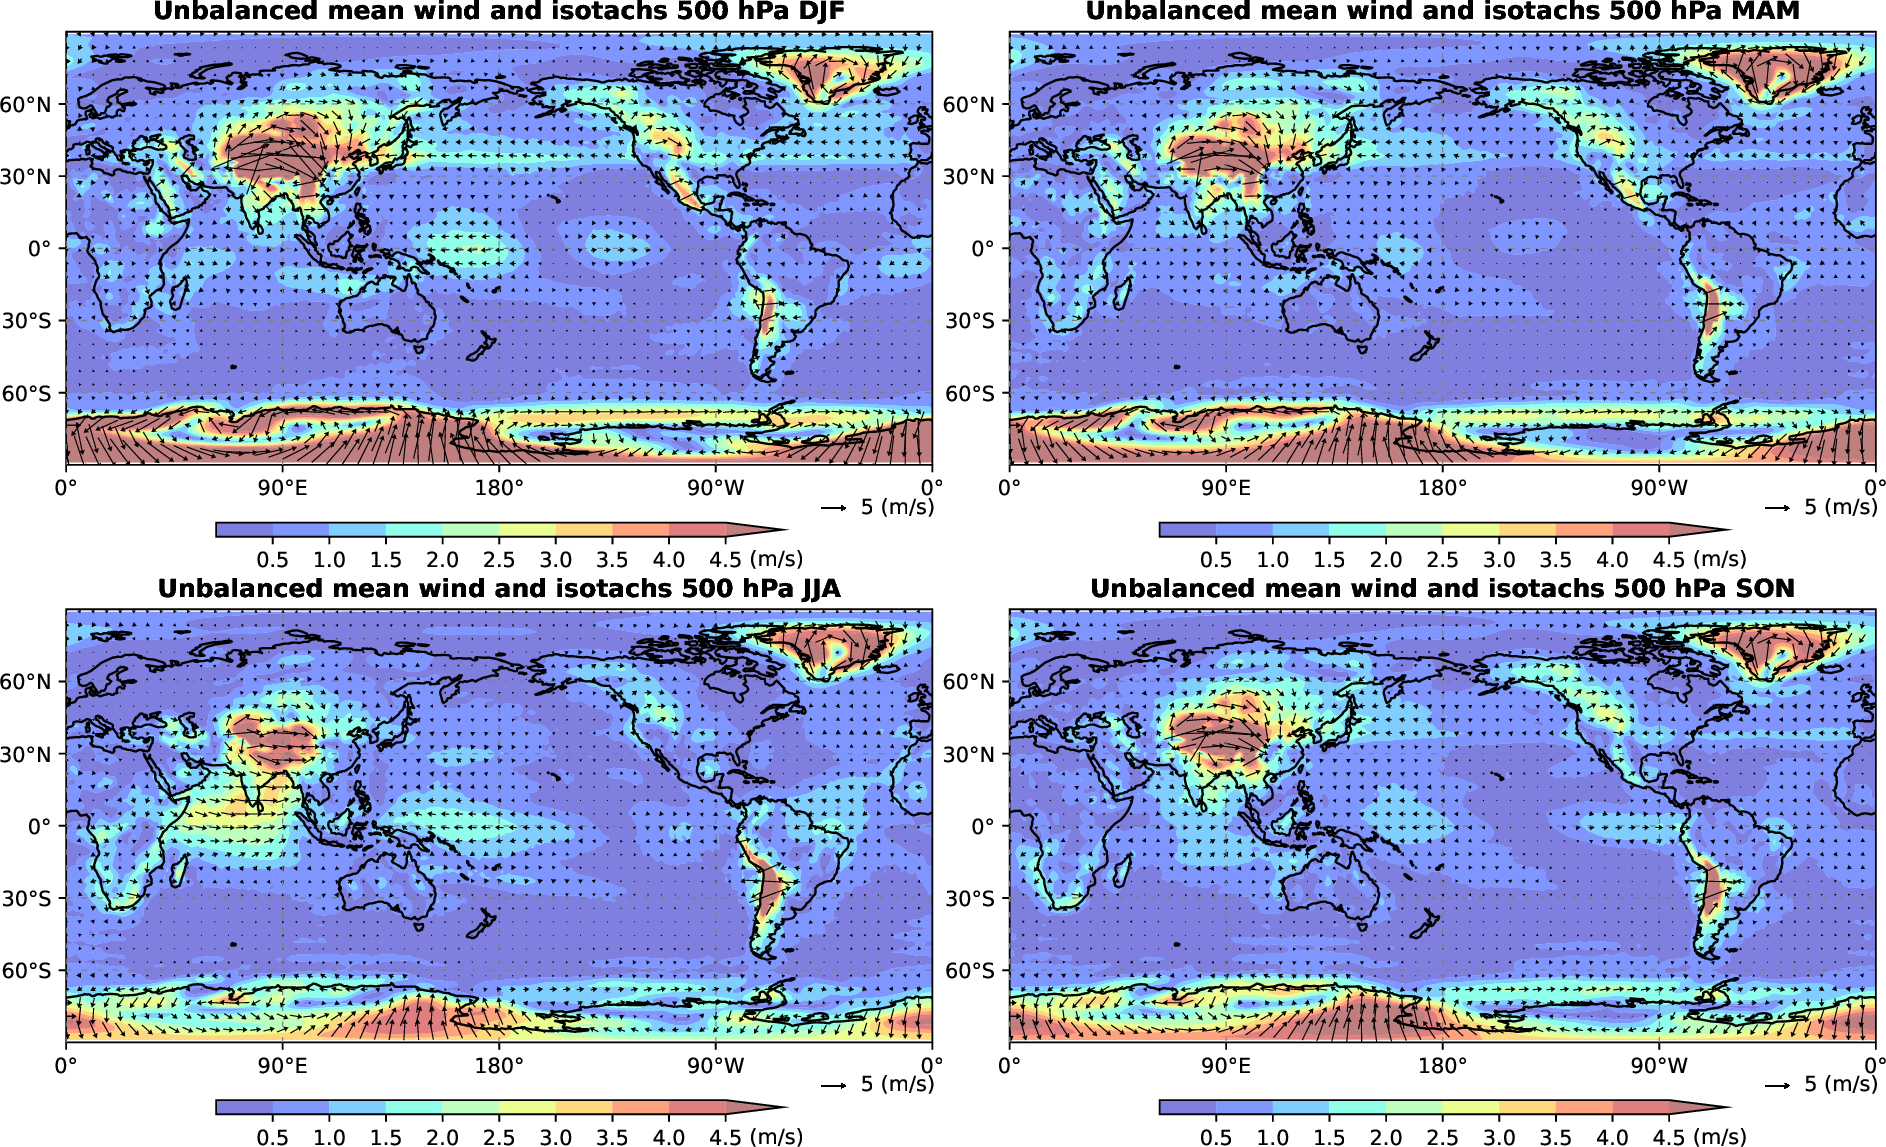
Unbalanced circulation
Climatological (1980-2019) seasonal averages of the horizontal wind (vectors and Isotachs) at sigma levels close to 1, 10, 100, 200 and 500 hPa. The winds were obtained by summation of all unbalanced (inertia-gravity and Kelvin) wave modes.
| Seasonal mean zonal wind 1 hPa | Seasonal mean zonal wind 10 hPa | Seasonal mean zonal wind 100 hPa | Seasonal mean zonal wind 200 hPa | Seasonal mean zonal wind 500 hPa |
 |
 |
 |
 |
 |
| Intra-monthly variability zonal wind 200 hPa | Intra-seasonal variability zonal wind 200 hPa |
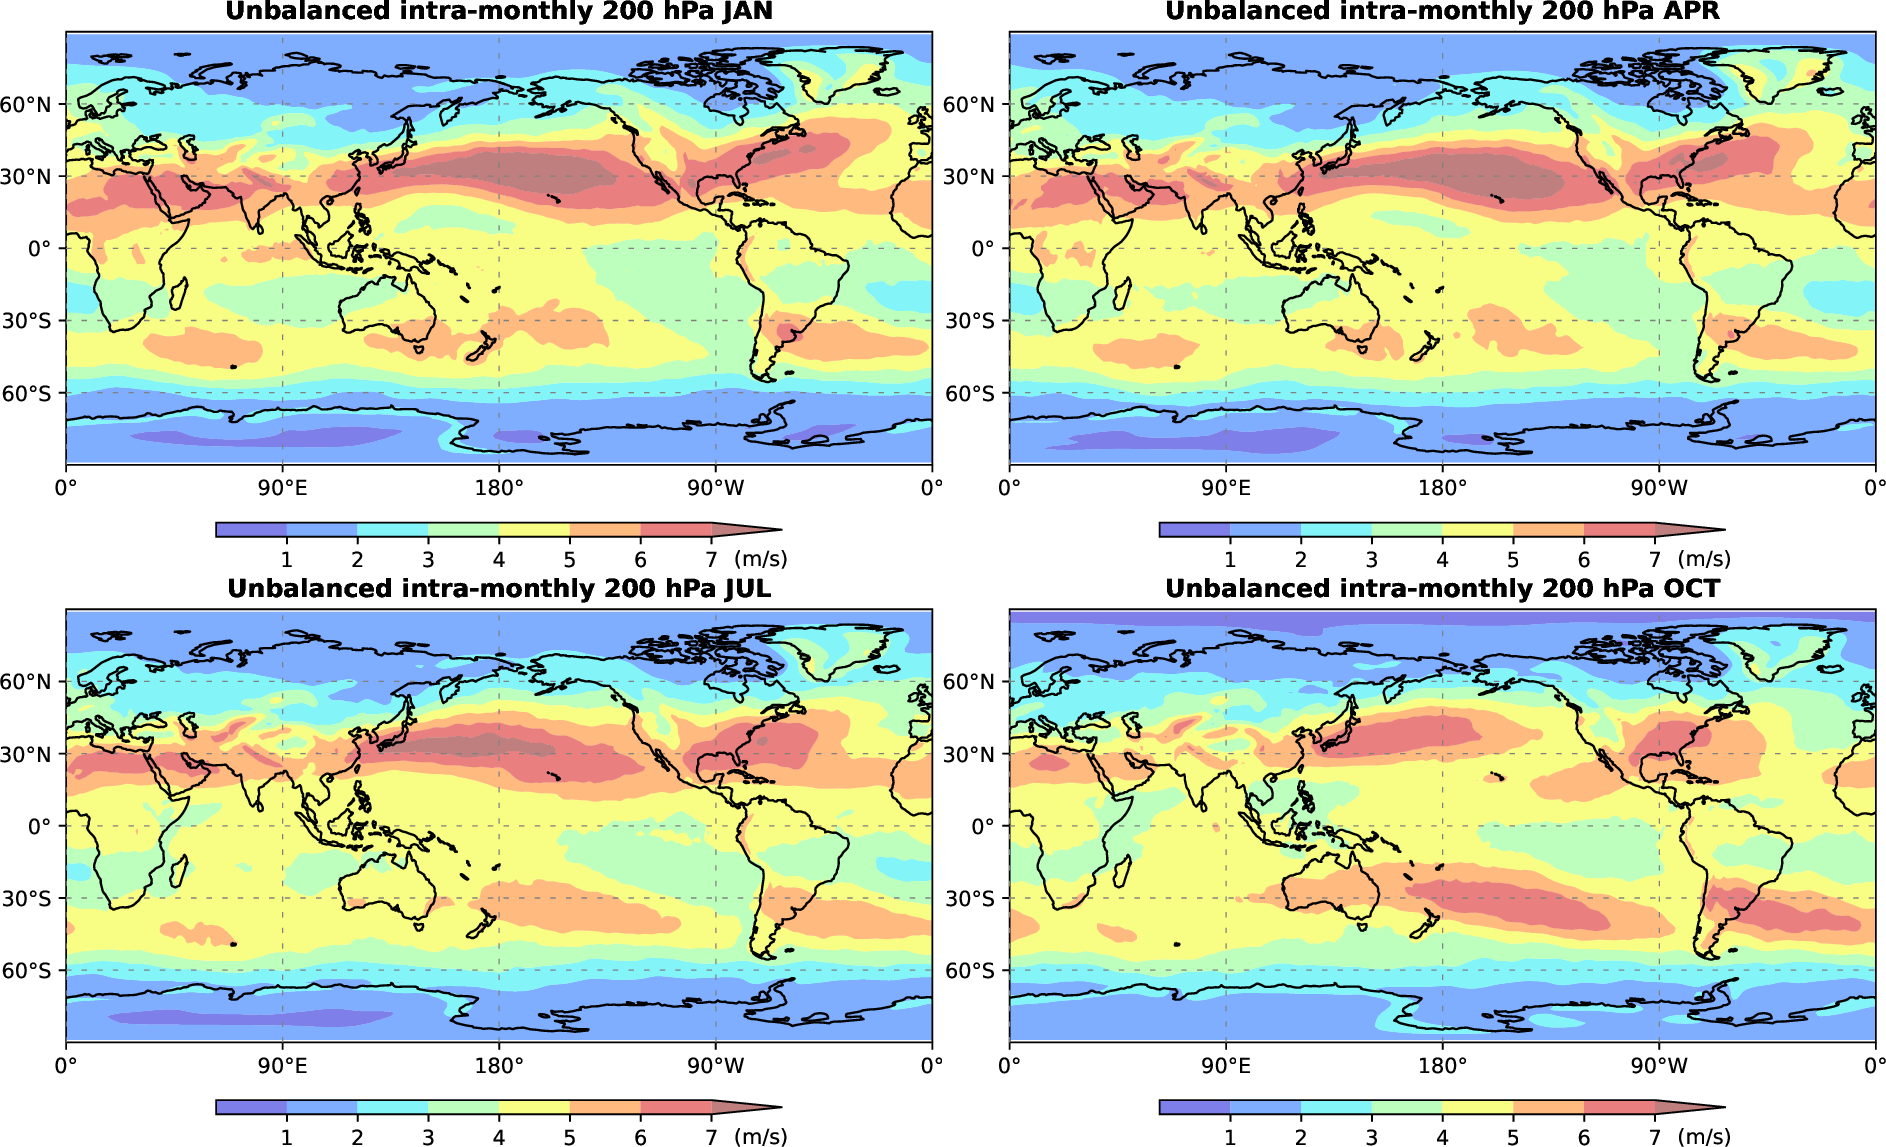 |
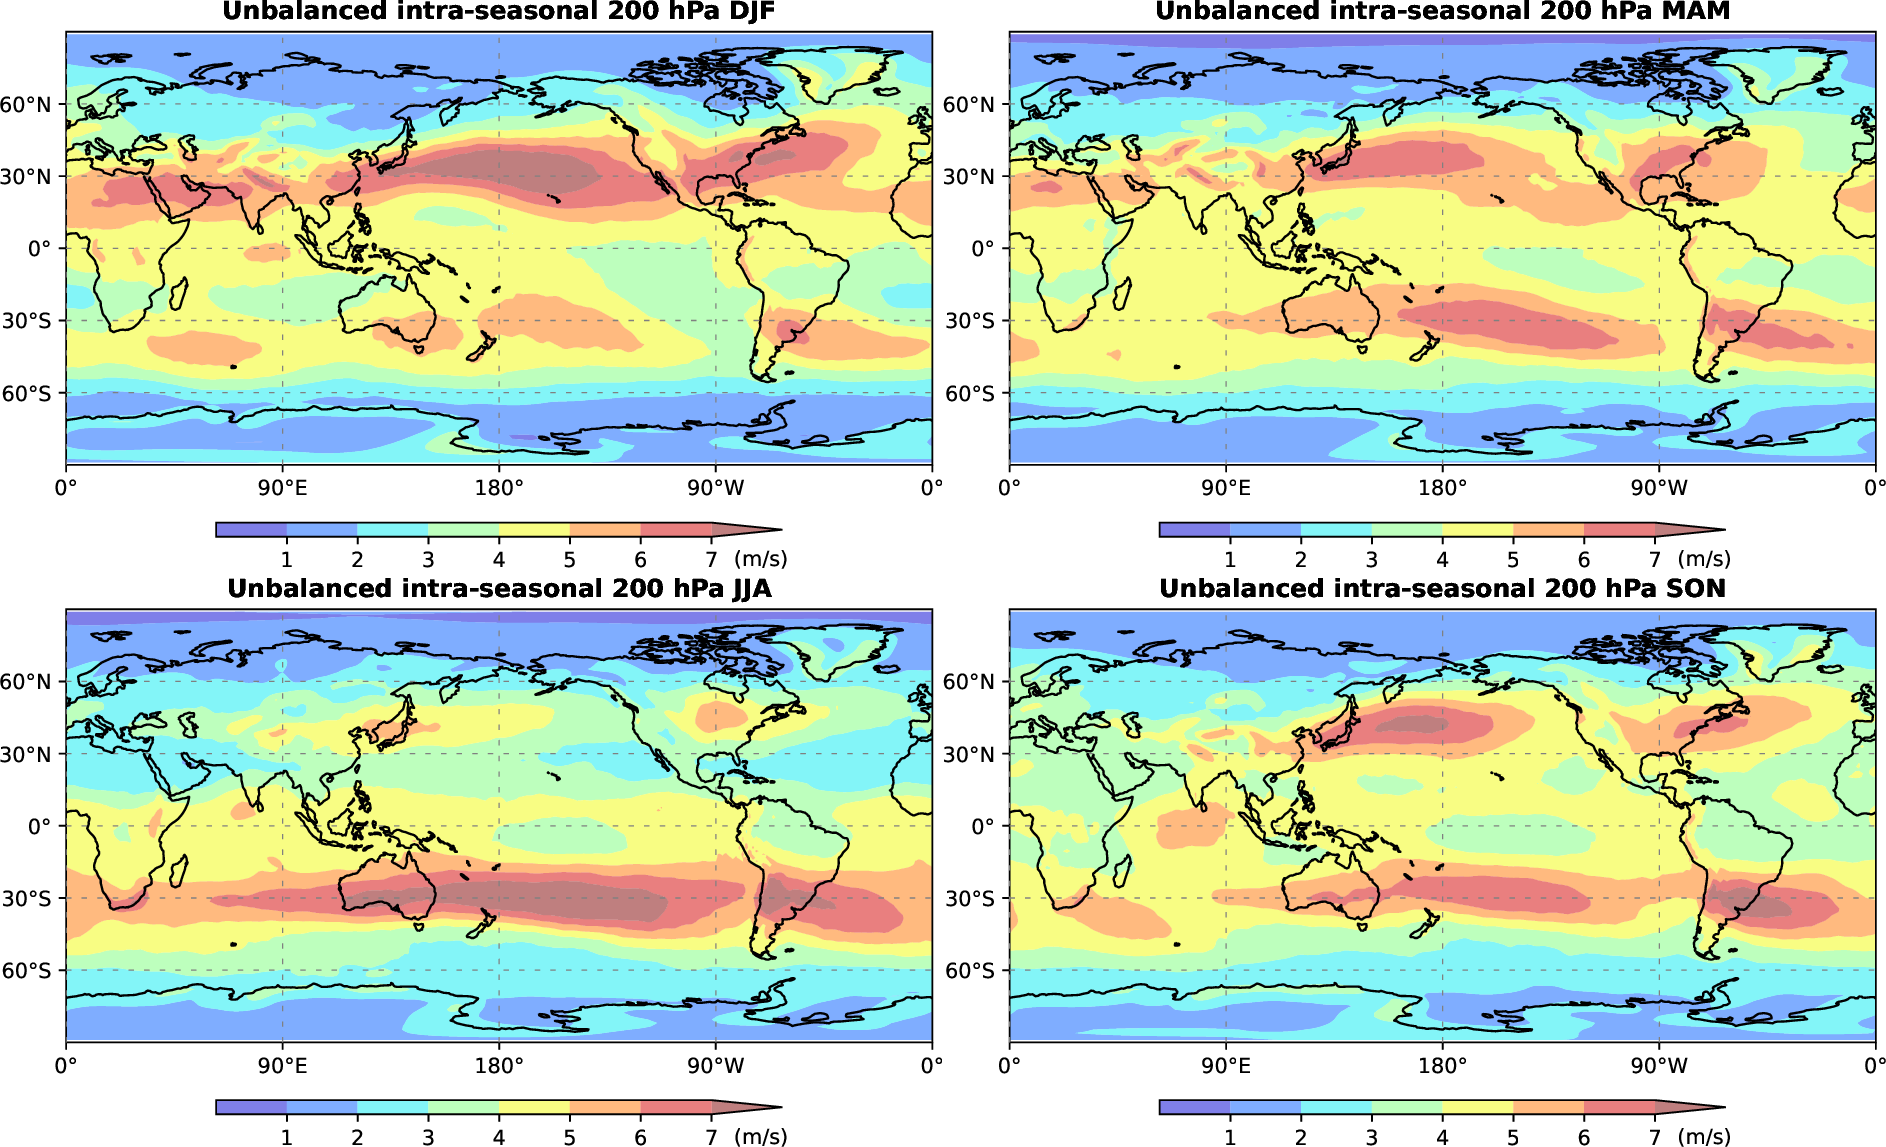 |
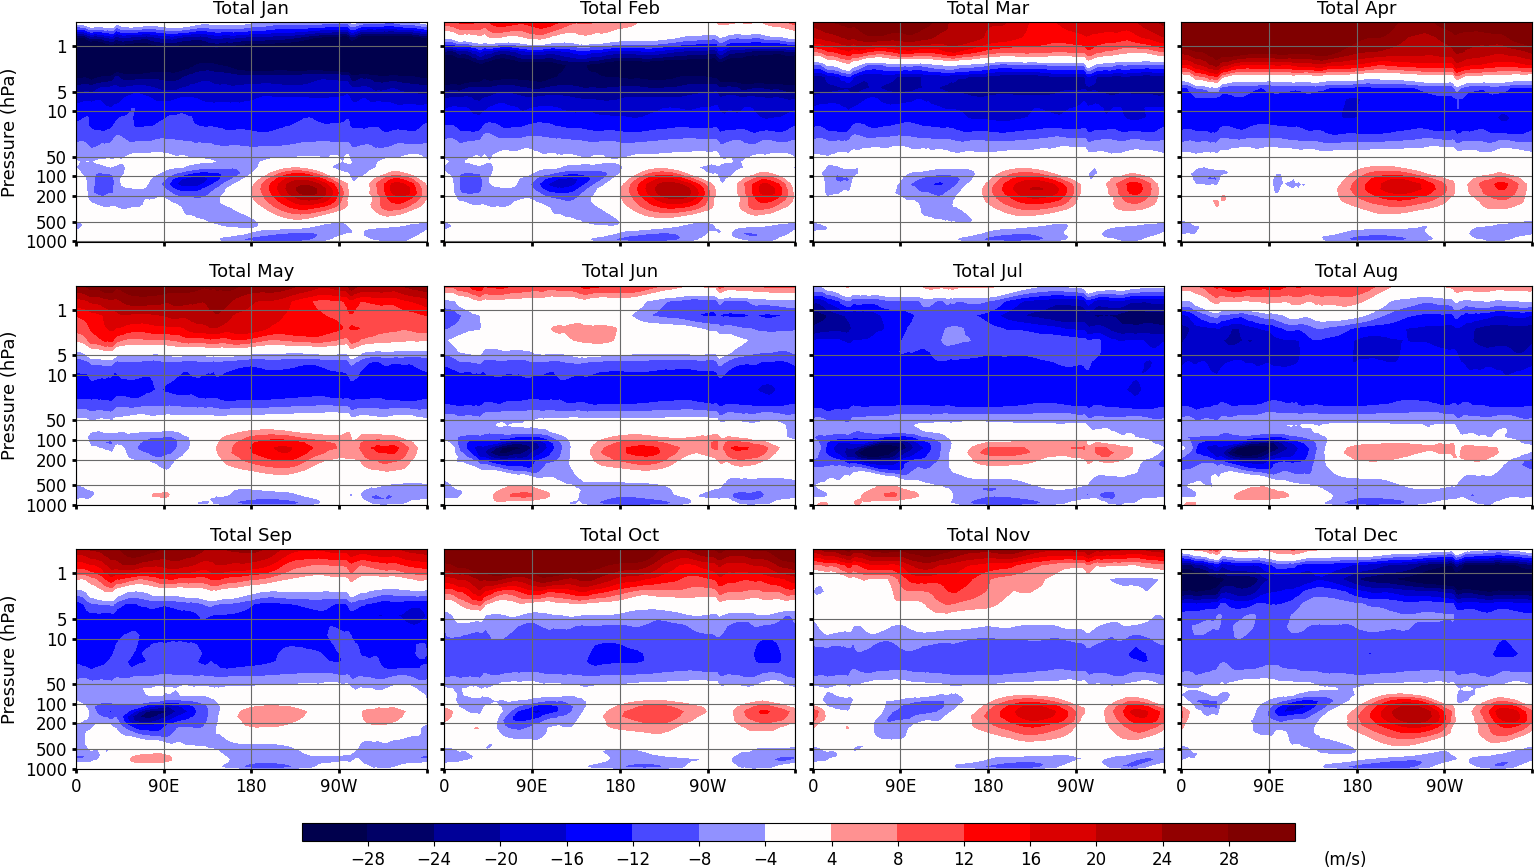
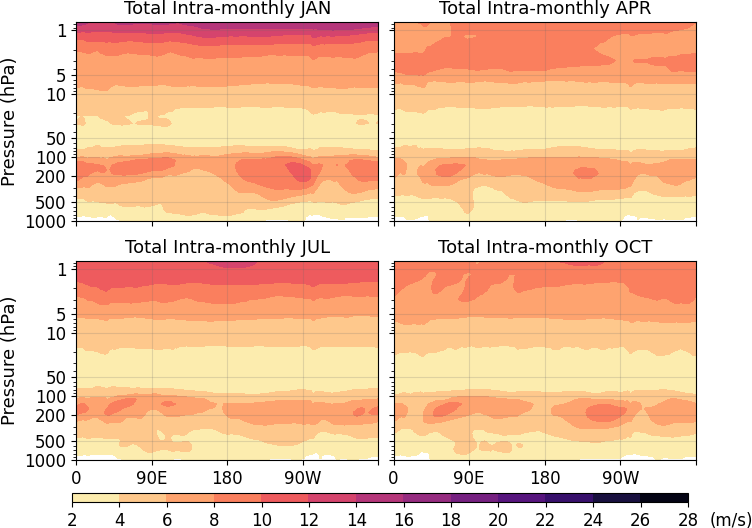
Longitude-Pressure
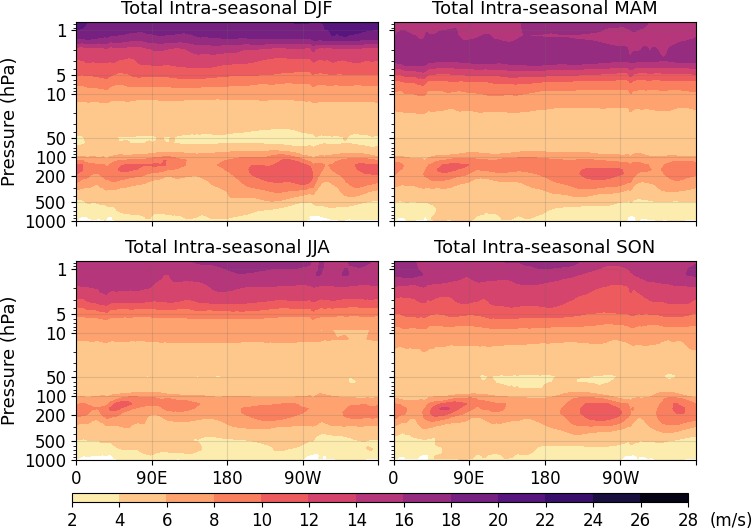
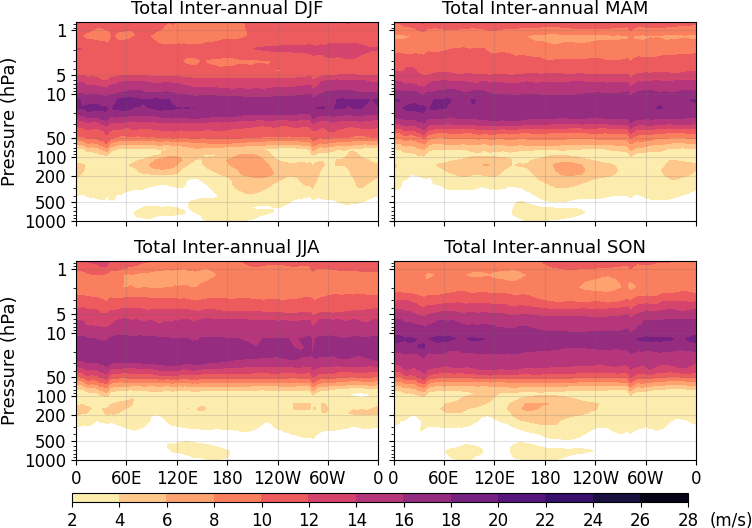
Total Circulation
Longitude-pressure cross sections of the climatological (1980-2019) monthly- and seasonal averages of the meridionally averaged zonal wind, the intra-monthly variability (standard deviation) of the zonal wind, the intra-seasonal variability (standard deviation) of the zonal wind and the inter-annual variability (standard deviation) of the zonal wind. The winds were obtained by summation of all modes.
| Monthly mean | Intra-monthly variability | Intra-seasonal variability | Inter-annual variability |
 |
 |
 |
 |
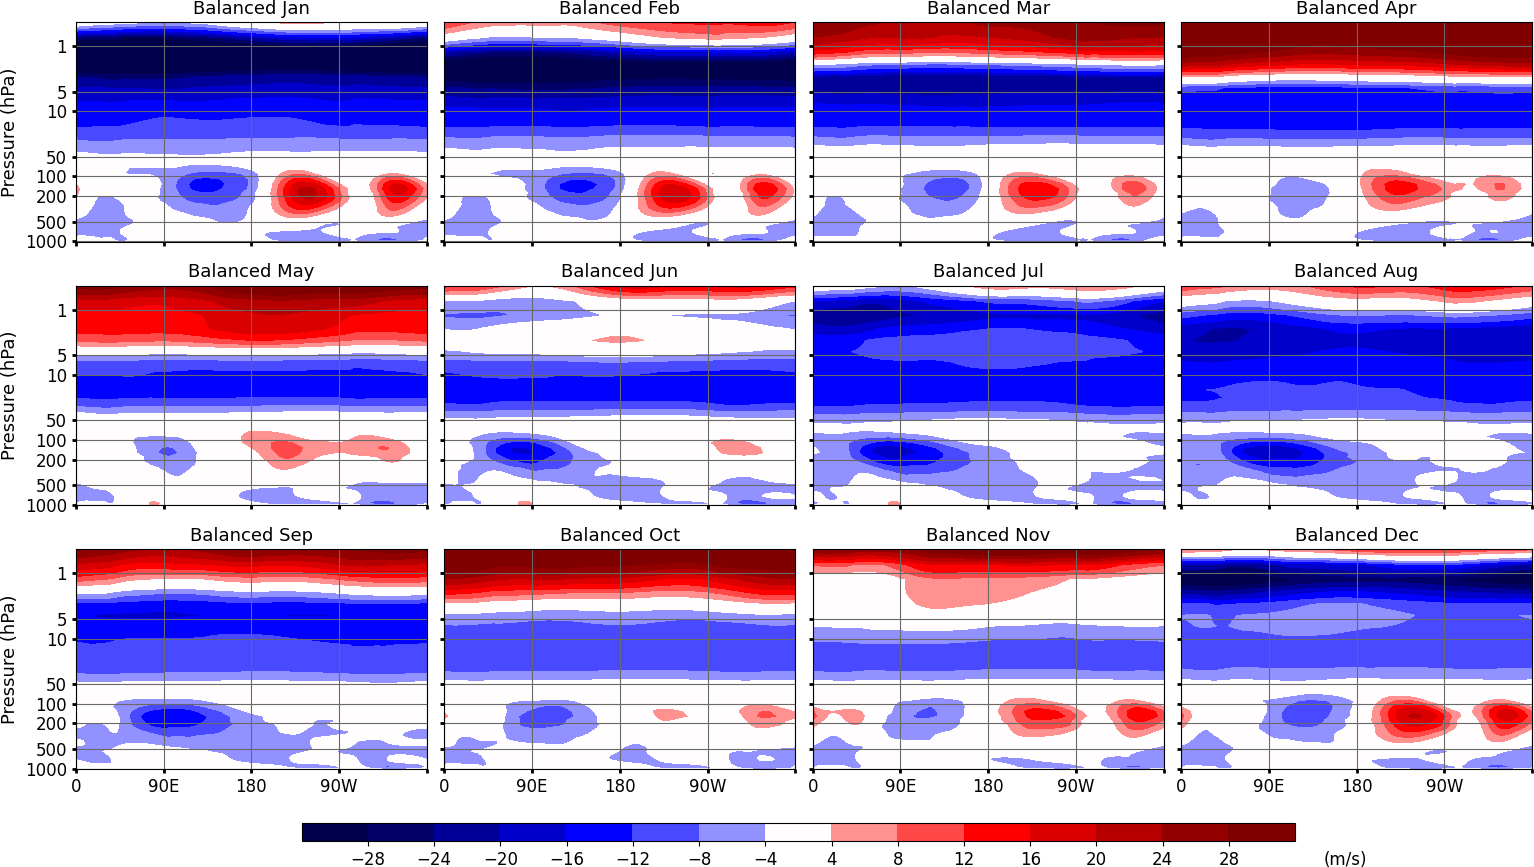
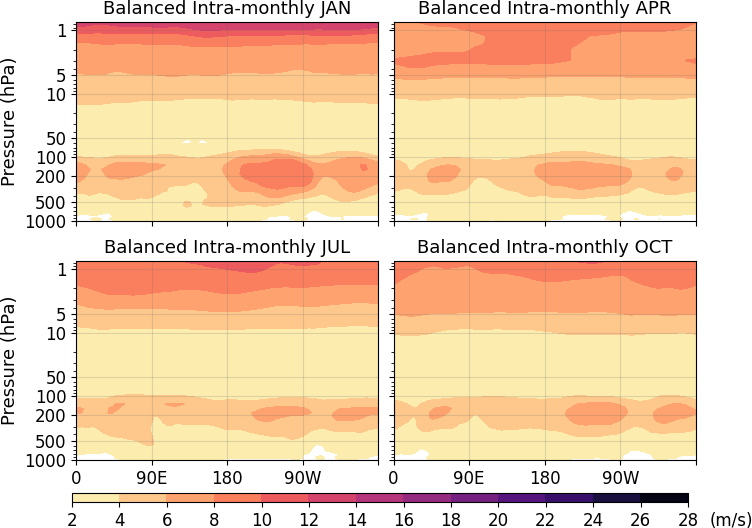
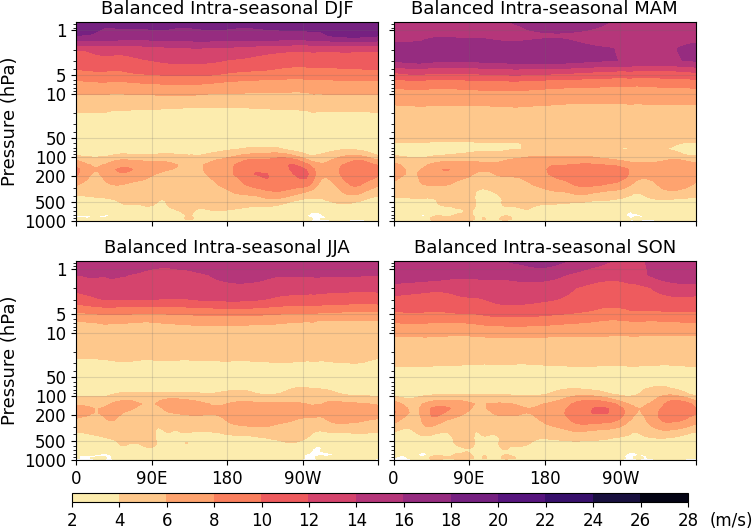
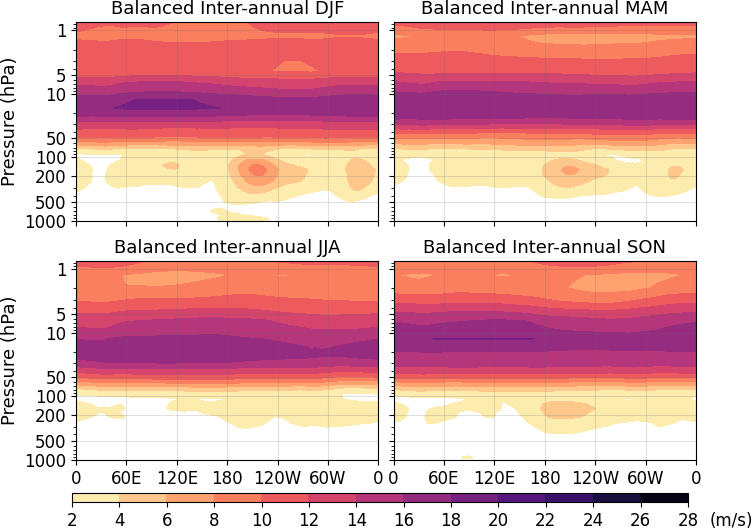
Balanced Circulation
Longitude-pressure cross sections of the climatological (1980-2019) monthly- and seasonal averages of the meridionally averaged zonal wind, the intra-monthly variability (standard deviation) of the zonal wind, the intra-seasonal variability (standard deviation) of the zonal wind and the inter-annual variability (standard deviation) of the zonal wind. The winds were obtained by summation of all modes.
| Monthly mean | Intra-monthly variability | Intra-seasonal variability | Inter-annual variability |
 |
 |
 |
 |
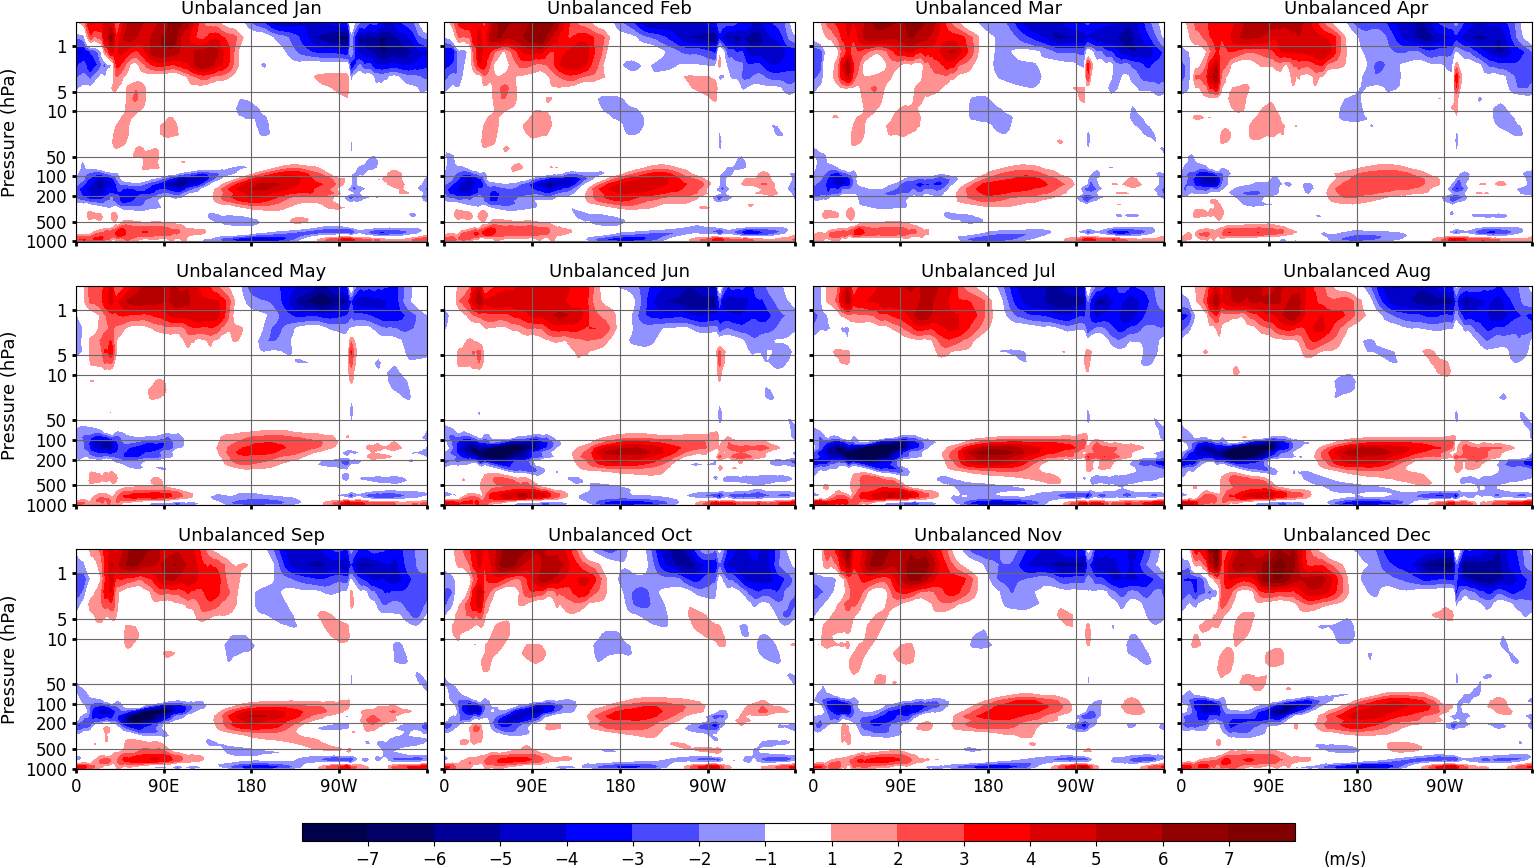
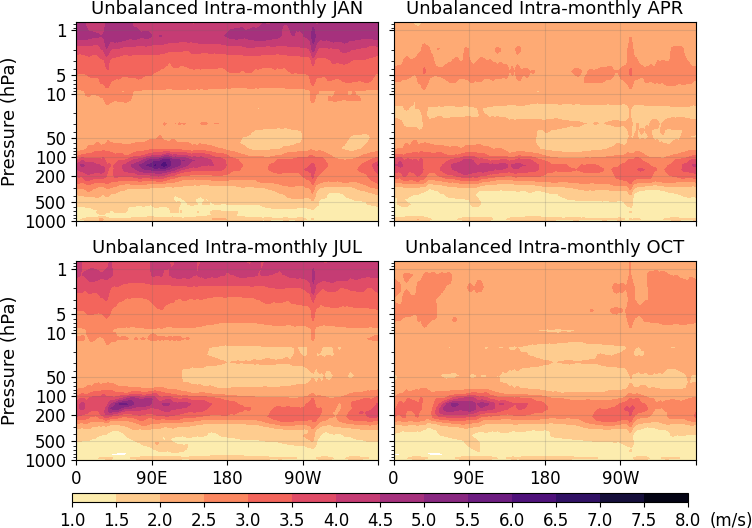
Unbalanced Circulation
Longitude-pressure cross sections of the climatological (1980-2019) monthly- and seasonal averages of the meridionally averaged zonal wind, the intra-monthly variability (standard deviation) of the zonal wind, the intra-seasonal variability (standard deviation) of the zonal wind and the inter-annual variability (standard deviation) of the zonal wind. The winds were obtained by summation of all modes.
| Monthly mean | Intra-monthly variability | Intra-seasonal variability | Inter-annual variability |
 |
 |
 |
 |
Quasi-biennial oscillation (QBO)
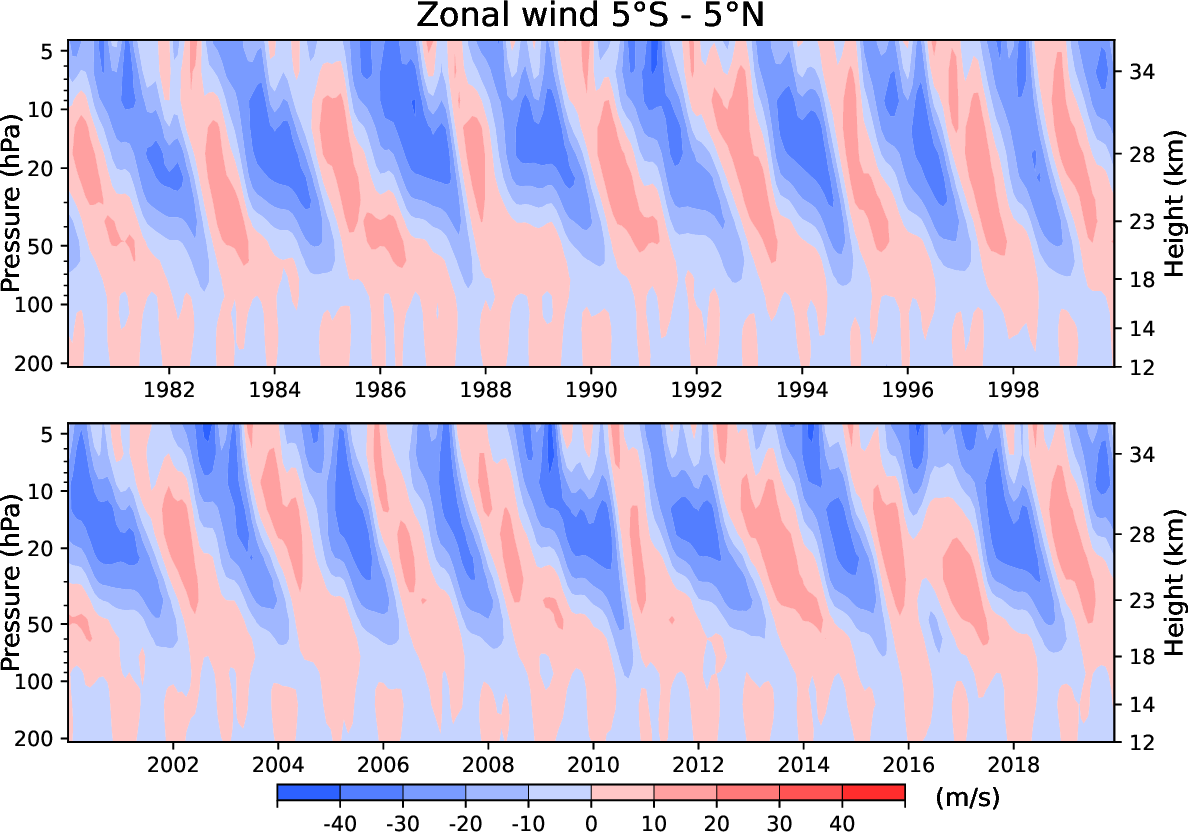
Total Circulation
Pressure-time diagrams (1980-2019) of monthly mean zonally averaged equatorial (5°S-5°N) zonal wind and the monthly standard deviation of the zonal wind between about 0.4 Pa and 200 hPa. The winds were obtained by summation of all modes.
| Monthly mean zonal wind |
 |
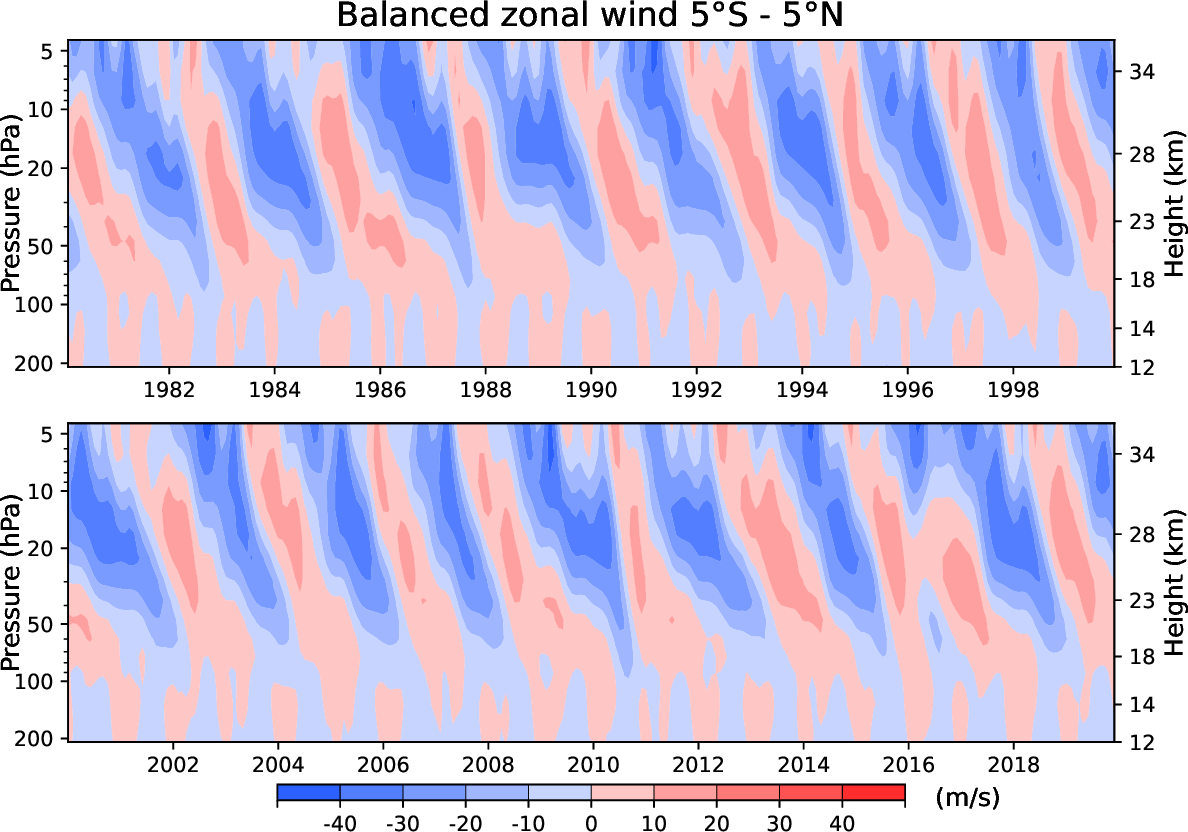
Balanced Circulation
Pressure-time diagrams (1980-2019) of monthly mean zonally averaged equatorial (5°S-5°N) zonal wind and the monthly standard deviation of the zonal wind between sigma levels close to 0.4 Pa and 200 hPa. The winds were obtained by summation of all linearly balanced (Rossby and mixed Rossby-gravity) modes.
| Monthly mean zonal wind |
 |